The week of August 17th to 21st was a difficult one in the market, with the S&P 500 down 5.7%. During the week, the DRS was down, but less than the S&P. As such, we have prepared these five key points to help you understand Swan’s performance over the last week. A more thorough commentary follows in the next section.

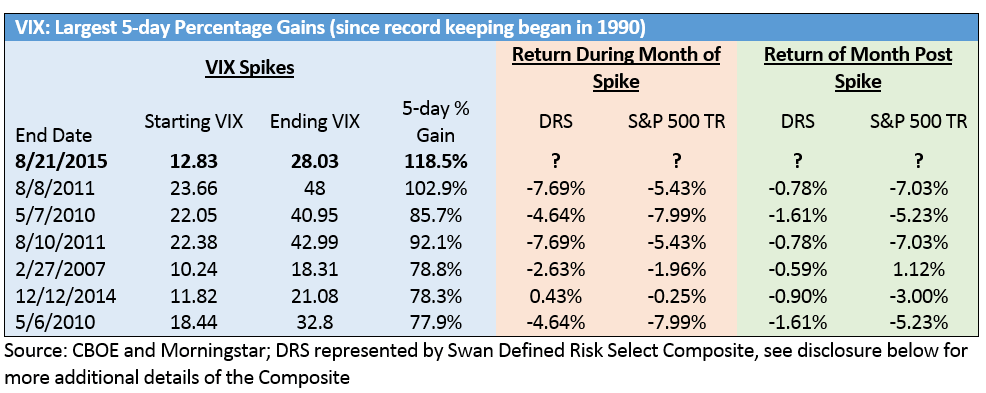
The DRS has gone through short-term pain many times before, as seen in the table above, however the DRS is designed to weather short term pain in order to deliver returns over the long term. We would like to highlight further detail for what occurred this past week.
Over the past few months, the S&P 500 has lost about 7% off its all time high in May. The week of August 17 to 21 the S&P 500 lost 5.7%, while the VIX rose 118%. Known as the “fear index”, the VIX’s one-week move was the largest since record keeping of the VIX began in 1990. The move over the last three market days of 103% was the second largest ever for the VIX, behind only the debt downgrade of August 2011 (105%). The VIX spiked over 46% on Friday alone, making it the fifth largest one-day move ever in the VIX. The primary factors driving this market drop and tremendous spike in volatility include:
During this period of time, the Swan Defined Risk Strategy has performed as we would expect in this type of market environment. The downside capture ratio during the past week was higher than what some newer investors might expect as a direct result of our income component’s unrealized losses caused by the decline in the market and spike in volatility. This short-term downside capture ratio should not be interpreted by investors as an indication on the effectiveness of the hedge; in fact, the hedge is fully in place and has actually performed better than expected during this time. Each portfolio is hedged at 100% of the notional value and is always in place.
More than 50% of the strategy’s decline over the past week is due to the income component, as should be expected from such a large VIX spike. At the same time, the better-than-expected performance of the hedge is due to its increased value attributed to the increase in volatility. We will always expect a temporary higher-than-expected downside capture ratio to be associated with a significant and rapid spike in volatility and the ultra short-term downside capture ratio will temporarily mask the true effectiveness of the hedge. Both components are still a necessary part and vital contributors to the overall strength of the DRS. Any unrealized or realized losses on our short-term options positions are only temporary and the sustained increase in volatility will allow our strategy to collect higher premiums from selling short-term options in the near future. The higher premiums collected should increase realized profits, helping offset the cost of the long-term hedge. As always, we will follow our approach to stay fully invested and fully hedged during all market environments.
If this is the beginning of what many consider a long overdue bear market, we believe there is no better strategy than the DRS across a full market cycle, both bull and bear.
If the current downtrend continues, our separation relative to the S&P 500 will likely accelerate as our hedge becomes more valuable. Based on past corrections, we would expect the hedged equity of our strategy to capture approximately 50% of the first 10% of a market drawdown, 25% of the next 10%, with minimal losses if the S&P 500 drawdown exceeds 20% over a period of time. Combined with our income trades there have been times in the past that the strategy has captured slightly more downside than the S&P in the short-term. This is not the case here due to the close proximity of the put to the market level.
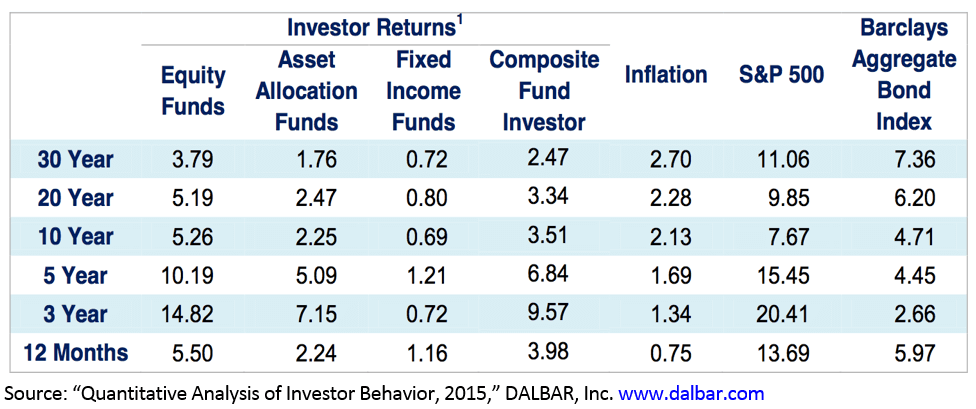
It is important to remember that Swan’s goal is to prevent large declines. Smaller short-term pain and drawdowns will occur with sudden spikes in volatility. This approach has proven itself numerous times over since 1997 through all types of market environments (Long Term Capital Management, 9/11, Tech and Financial bubbles, Flash Crash, downgrade of U.S. Debt) and we believe will continue to do so in future events. Studies have conclusively shown that shortsighted and ill-advised attempts to time the market by getting in and out, especially during periods of extreme volatility, have harmed investors. DALBAR releases each year a study called “Quantitative Analysis of Investor Behavior” which points to the inherent dangers of investors trying to time the market, as seen here in this year’s study:

The information above from the DALBAR study shows how poorly the average investor has performed compared to the market due primarily to fear and resulting attempts to time the market by getting in and out of their investments. Investors likely become frightened in down markets, finally cannot take it any longer, and sell at a low and then take too long to get back in and end up buying at a high. While the S&P 500 posted a healthy annualized return of 11.06% over 30 years, the average mutual fund investor gained a paltry 3.79% over the same period. A $100,000 investment compounded at 3.79% per year grows to $305,257 over 30 years, whereas an 11.06% growth rate increases that value to $2,326,645 — a staggering difference in wealth.
Swan’s unique Defined Risk Strategy (DRS) provides investors an alternative or complement to traditional asset allocation strategies. The DRS is designed to seek absolute returns with separate but complementary components for up, flat, and down markets. Most importantly, the DRS is designed to seek to minimize unsystematic and systematic risk.

The approach and structure of the DRS is specifically built to help investors stay the course through bull and bear markets by recognizing that smaller shorter-term drawdowns are more easily weathered by having protection in place for larger, steeper declines. Significant declines are part of a full market cycles and should actually benefit the strategy when we are able to potentially sell the hedge at a significant profit and purchase more equity at a lower price while also an expectation of increased profits from our option selling as demonstrated in 2009. The compounding effect of these additional shares along with potentially increased income from our options selling in combination with the significant defined risk protection are what differentiate our strategy from our competitors. This feature is highly desirable and should be eagerly anticipated by investors in spite of limited losses when the market declines 20%+.
It is important to remember that portfolios are hedged above current market levels. In other words, protection is already in place and working to lock in and protect capital from a baseline level higher than the current market level. This is what might be referred to as the deductible area of the strategy and the downside capture ratio is expected to improve with each successive decline of the market and ultimately cover 1:1 market declines at or near a 20–25% decline in the market.

Founder, President and Lead Portfolio Manager of Swan Global Investments
Randy Swan, CPA is the founder, President and Lead Portfolio Manager of Swan Global Investments and the creator of the proprietary Defined Risk Strategy (DRS). In 1997, recognizing the limitations of Modern Portfolio Theory and the difficulty of market timing and picking stocks, Randy developed the Swan Defined Risk Strategy to help investors achieve capital appreciation while seeking protection from large losses. As Lead Portfolio Manager of Swan and the DRS, Randy oversees and manages the strategy across numerous product portfolios and asset classes such as large cap stocks, emerging market stocks, foreign developed stocks, small cap stocks, long-term bonds, gold, and more. Across each product/portfolio, the DRS strategy seeks to define the risk, reduce volatility, limit large losses and match or exceed the long-term performance of the stock market over an entire investment cycle (peak to trough). This is all from the perspective of helping investors to achieve a more consistent and smoother longer-term investment experience.
Swan Global Investments, LLC is a SEC registered Investment Advisor that specializes in managing money using the proprietary Defined Risk Strategy (“DRS”). SEC registration does not denote any special training or qualification conferred by the SEC. Swan offers and manages the DRS for investors including individuals, institutions and other investment advisor firms. Any historical numbers, awards and recognitions presented are based on the performance of a (GIPS®) composite, Swan’s DRS Select Composite, which includes nonqualified discretionary accounts invested in since inception, July 1997, and are net of fees and expenses. Swan claims compliance with the Global Investment Performance Standards (GIPS®). All data used herein; including the statistical information, verification and performance reports are available upon request. The S&P 500 Index is a market cap weighted index of 500 widely held stocks often used as a proxy for the overall U.S. equity market. Indexes are unmanaged and have no fees or expenses. An investment cannot be made directly in an index. Swan’s investments may consist of securities which vary significantly from those in the benchmark indexes listed above and performance calculation methods may not be entirely comparable. Accordingly, comparing results shown to those of such indexes may be of limited use. The adviser’s dependence on its DRS process and judgments about the attractiveness, value and potential appreciation of particular ETFs and options in which the adviser invests or writes may prove to be incorrect and may not produce the desired results. There is no guarantee any investment or the DRS will meet its objectives. All investments involve the risk of potential investment losses as well as the potential for investment gains. This analysis is not a guarantee or indication of future performance. Prior performance is not a guarantee of future results and there can be no assurance, and investors should not assume, that future performance will be comparable to past performance. Further information is available upon request by contacting the company directly at 970.382.8901 or visit www.swanglobalinvestments.com. 061-SGI-030317