Lessons for Investors Looking at Historical Patterns of Market Volatility

Throughout the history of the US stock market, we have seen multiple regimes of volatility play out. Some of these periods are marked by sporadic and vicious market spikes, where other periods are noted for their muted long-term trends.
While we cannot predict the future, we should recognize that market movements and waves of volatility often echo previous patterns. Therefore, by understanding the past we may better identify the pattern we’re in today. This is especially important when considering strategies that seek to capitalize on volatility trends.
A hundred years ago the US was at the infancy of what would become The Roaring 20’s. However, the decade began in an auspicious manner, infected with extreme volatility.
At the end of the previous decade, the country was in the beginning of advanced industrialized production creating a super-charged economy with relatively robust capital and resources. As European economies were decimated through World War I, the delayed US involvement in the war paved the way for the nation to become a global superstar with increased domestic productivity, low unemployment, social prosperity, and an overflowing piggy bank ready to be loaned out (at a cost) to weakened allies desperate for capital liquidity.
Like a newly formed planet, the US experienced periods of extreme hot and cold economic temperatures as employment spiked and waned with soldiers coming home from WWI looking for work in 1918, to the Spanish Flu cutting down the workforce and creating excess employment opportunities.
Our portfolio managers and analysts are dedicated to creating relevant, educational Articles, Podcasts, White Papers, Videos, and more.
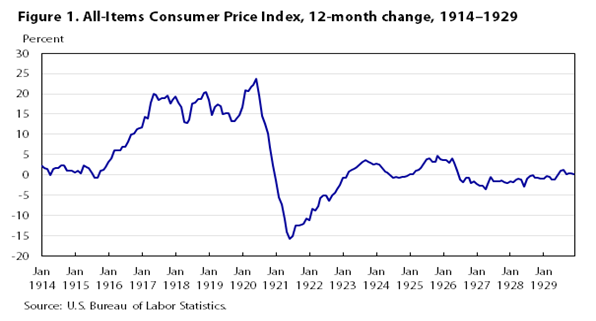
In the late 1910’s a novice US Central bank raised rates with fervor in an effort to stem what it believed to be overheated growth. The massive rise in synthesized inflation peaked at over 20% in 1920 only to unwind and cause massive deflation in the following year.
As noted by Milton Freedman and Anna Schwartz in A Monetary History of the United States, the reduced productivity from the Spanish Flu pandemic along with overzealous monetary policy were suspects in the proverbial crime of driving up inflation and causing unemployment to spike from 5.2% to 11.67% in 1920-1921. These were times bookmarked by intermittent periods of high and low volatility, societal anxiety, and economic uncertainty, but the party was just getting started.
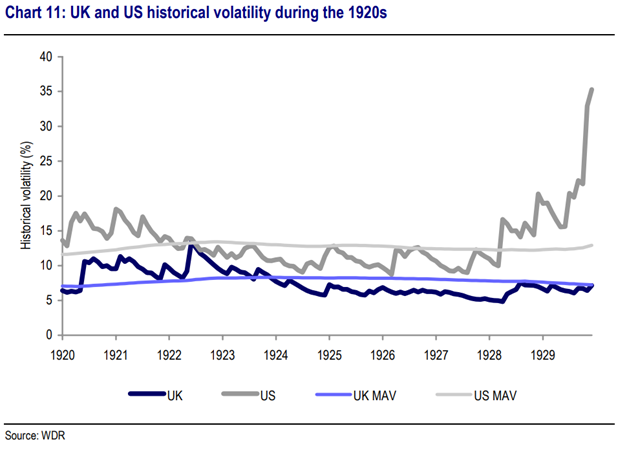
Fifty-seven years before Prince’s hit single “1999”, there was another party starting to materialize. By 1925 stubborn inflation finally softened and normalized, and the US economy again began overheating in a new era later referred to as the roaring twenties. That same year, a future engineer named John DeLorean was born. His contribution to the auto industry (and of course, cinematic history) will be referenced later in our discussion.
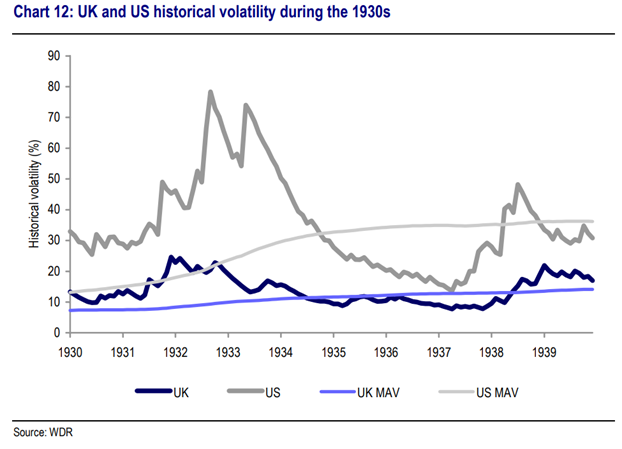
Whereas the late 1910’s and early 20’s were noted for their unprecedented short-term extremes, the remainder of the roaring 20’s and Depressing 30’s were characterized by their longer-term fame and infamy respectively. As much as the 20‘s was marked by low volatility, the 1930’s was the most volatile decade in US history, doubling the previous decade’s moving volatility average.
The Post Wartime Bull Market of the 1940’s and 50’s was marked by higher equity returns and low volatility, followed by the market peaking in the mid 1960’s. However, this unprecedented period of growth and prosperity would see itself succumb to the hyperinflation of the late 70’s leading the Federal Reserve to raise the Fed Funds Rate up to 20% by 1981.
Like Marty McFly in the movie Back to the Future, let’s leap forward using that iconic DeLorean Time Machine to find ourselves in the midst of a raging Bull Market in 1985, the year of the film’s debut. With the exception of Black Monday in 1987 and the volatility of 1998 caused by the Russian Debt Crisis / implosion of Long Term Capital Management, the mid 80’s through 90’s were a time of peace and prosperity in terms of domestic stock market returns along with relatively low volatility.
This excess did not come without a cost. The avarice, unrealistic investor expectations, and right-tail capitulation of the 1990’s set the stage for the next long-term trend. One that would delay or derail retirement dreams and strike fear into the heart of investors for years to come.
Like a concussed quarterback on Monday morning looking at game film from the day before, we can look back on more recent history to identify times of volatility war and peace. Such as the Bull Market of the 1990’s, the Tech Bubble implosion of 2000-2002, the recovery lull of 2003-2006, and the chaos of the Financial Crisis.
However, as you look over the last 10 years, the trends have become harder to identify, as times of war and peace have been replaced with fierce battles and brief reprieves in terms of volatility (see chart below).
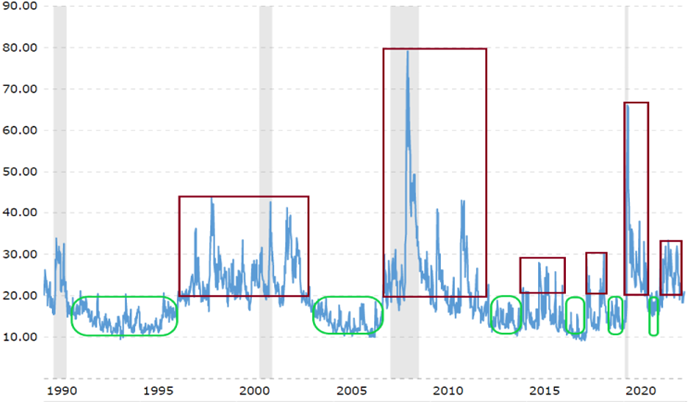
Source: MacroTrends
Investors should be cognizant that past returns really do not guarantee future results and use their experience and flexibility to adjust their processes accordingly. The strategies that worked efficiently over the last 30 years may not be as effective through this higher rate, trendless volatility regime.
The YouTube, “do it yourself” ideology may work fine for fixing a doorknob or changing a dishwasher filter but can lead to disaster when applied to Investments. It is important, now more than ever, retail investors seek the advice from dedicated investment professionals who are best equipped to assess financial risk vs reward.
At Swan Global Investments, we believe that guarding your portfolio against large, long-term market drawdowns is just as important as being fully invested through bull market cycles. However, we also recognize that we are likely in for some extreme short-term volatility events and continue to execute our active management processes accordingly.
Jeff Thomas, National Director – Advisor Advocacy for Swan Global Investments, and host of the Investment Masterminds series for advisors, dedicated to bringing premier speakers from across the industry to add value to a growing network of Financial Advisors.
Our portfolio managers and analysts are dedicated to creating relevant, educational Articles, Podcasts, White Papers, Videos, and more.
Swan Global Investments, LLC is a SEC registered Investment Advisor that specializes in managing money using the proprietary Defined Risk Strategy (“DRS”). SEC registration does not denote any special training or qualification conferred by the SEC. Swan offers and manages the DRS for investors including individuals, institutions and other investment advisor firms.
All Swan products utilize the Defined Risk Strategy (“DRS”), but may vary by asset class, regulatory offering type, etc. Accordingly, all Swan DRS product offerings will have different performance results due to offering differences and comparing results among the Swan products and composites may be of limited use. All data used herein; including the statistical information, verification and performance reports are available upon request. The S&P 500 Index is a market cap weighted index of 500 widely held stocks often used as a proxy for the overall U.S. equity market. The Bloomberg US Aggregate Bond Index is a broad-based flagship benchmark that measures the investment grade, US dollar-denominated, fixed-rate taxable bond market. The index includes Treasuries, government-related and corporate securities, MBS (agency fixed-rate and hybrid ARM pass-throughs), ABS and CMBS (agency and non-agency). Indexes are unmanaged and have no fees or expenses. An investment cannot be made directly in an index. Swan’s investments may consist of securities which vary significantly from those in the benchmark indexes listed above and performance calculation methods may not be entirely comparable. Accordingly, comparing results shown to those of such indexes may be of limited use. The adviser’s dependence on its DRS process and judgments about the attractiveness, value and potential appreciation of particular ETFs and options in which the adviser invests or writes may prove to be incorrect and may not produce the desired results. There is no guarantee any investment or the DRS will meet its objectives. All investments involve the risk of potential investment losses as well as the potential for investment gains. Prior performance is not a guarantee of future results and there can be no assurance, and investors should not assume, that future performance will be comparable to past performance. Further information is available upon request by contacting the company directly at 970-382-8901 or www.swanglobalinvestments.com.
079-SGI-032823