It may seem an eternity ago, but at the end of 2017 everyone was wondering why there was such a lack of volatility in the markets. Well, 2018 showed us how quickly things can change. January 2018 was on pace to have one of its best months in nearly 30 years. The S&P 500 Total Return finished positive by 5.73% after giving back some performance the last few days of the month. The last time we saw this kind of rally was back in January 1989 when it gained 7.32%, the best month over the last 30 years.
While some investors were shocked by the spike in volatility, careful analysis of the overall volatility curve and a characteristic called “skew” can provide valuable insight to market expectations. As the current bull market was raging upwards in January, an interesting development was occurring with respect to the shape of the volatility curve: as the market went up, so did volatility. At the time of this writing (2-12-18), volatility has now taken on an entirely different characteristic, but this will be explored in a second post. This post will focus on January’s volatility curve.
In a previous blog post, “Where Is the Volatility?”, we broke down the construction of the VIX index. In it, we dispelled the notion that the VIX is a “fear index.” At its core, the VIX does not measure fear or volatility, but instead the supply and demand for short-term options. The supply and demand of various puts and calls are dynamic with their prices shifting according to market expectations.
In normal market conditions, volatility is expected to decrease when the underlying market rallies and increase when the underlying market falls, affecting the demand for calls and puts. Historically, downside movements have been much greater and faster than movements to the upside, some would say the markets take the stairs up but the elevator down. This rapid move to the downside causes people to buy more protection. Thus, there is a greater tendency to purchase downside protection when markets move down than the tendency to purchase upside calls when the market moves up. This difference between the demand for puts and calls creates what we call the volatility skew.
In January 2018, however, rather than taking the stairs up, the market took the elevator up. The upward move in the S&P 500 increased realized volatility and, as a result, also increased implied volatility, albeit at a slower pace than what a typical 6% trading range should justify. With the market at or near all-time highs, one would expect for volatility to be low, but the volatility curve was repricing itself and increased, instead of decreased, volatility, creating an interesting volatility skew.
The volatility skew can provide some valuable information for those trading options. But what exactly is it?
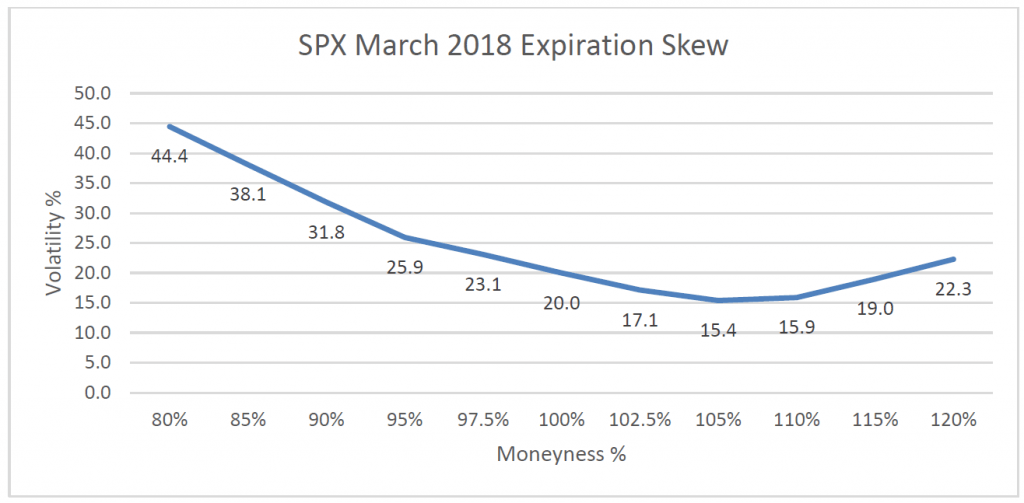
Volatility skew is the graphic representation of the implied volatilities of individual options at given strike prices within a particular expiration window. Once we have the data, we plot the volatility skew in a grid such as the one below with the implied volatilities along the y-axis and the strike prices on the x-axis. Each strike will have its own volatility measurement that is expressed as a percentage.

The graph above illustrates how in typical markets puts are valued more highly than call options. Investors fear downside moves in the market more than they anticipate upside gains, so the relative influence puts have on volatility measures is outsized. This kind of skew is also referred to as a “smile.”
Option prices are based on probabilities, and the volatility used for each strike basically assigns more or less value to a specific option. Remember the sum of all possibilities for an event to occur must be equal to 100%. If I have an apple pie and cut it into several slices, it does not matter how many slices I have, it will still be one pie. Option pricing is based on the same premise. The implied curve above has not only cut the pie into “slices,” but assigns more to some sections (strikes) and gives less to other sections (strikes).
Traders use proprietary models based on mathematical formulas to “smooth” out any possible kinks created by intra-day supply by allocating the appropriate amount of the “volatility pie” to each strike based on supply and demand.
Careful what you wish for.
It is difficult to determine what exactly is causing this extended low-volatility environment or to predict how long it will last. Even if high correlations are discovered, they rarely remain constant. Without being able to pinpoint a specific cause, it is virtually impossible to predict what will result in a spike or when the low volatility will end. This, coupled with the frailties of human nature, presents a low probability expectation for market timing strategies.
A Rude Awakening
Often, prolonged periods of low volatility are followed by violent spikes in volatility, as market participants who have been lulled to a false sense of security are awakened by an event of some sort. We don’t know when or how, but volatility will not remain so low forever and a new vol regime will arise.
So, what is the best way to handle the unpredictable and uncertain low volatility environment? To remain always invested and always hedged.
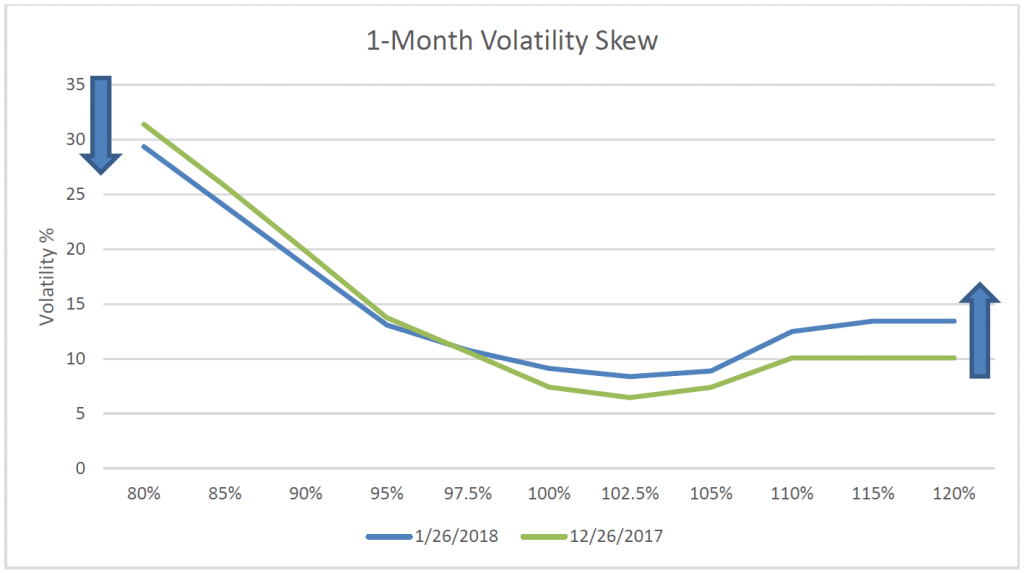
The graph below shows the volatility skew for the SPX for a 1-month maturity. From 12-26-17 to 1-26-18 one can clearly see how downside strikes (out of the money) puts declined in value vis-a-vis upside calls (out of the money calls). Although subtle, the curve on 1/26 is a bit flatter than it was on 12/26. Option traders call this a decrease in skew. This does not necessarily translate into a lack of downside hedging, but rather a greater demand for upside strikes. The market moved up so fast and so far in January, upside strikes became more important in volatility calculations.

One of the reasons for an increase in volatility and decrease in skew in January is attributable to many market participants being short upside calls (overwriters) and being forced to cover as the market continued to increase. In addition, with option volatility still at historic lows, stock replacement strategies via purchasing outright calls or call spreads were being implemented as opposed to purchasing outright stock. The phenomenon of a rising market and a rising volatility cannot last forever; it’s a simple repricing of the risk premia for an increase in realized volatility.
Takeaways
In summary, volatility does not always go down during market rallies. The key thing is whether we are in new territory that warrants a re-pricing of the volatility curve. We’ve made the argument previously that volatility tends to trade in “regimes” of low-vol, mid-vol, and high vol. Certainly, 2017 was a low volatility regime. Do the speed, duration, and magnitude of the market’s movement in January and February herald a regime change? Are the halcyon days of easy money over? Only time will tell, but if realized volatility moves higher, expect an increase in implied volatility which can directly lead to trading opportunities.
Chris Hausman, CMT®, Portfolio Manager, Managing Director-Risk, focuses on risk assessment and management for the Defined Risk Strategy investments and positions. He monitors risk across all of Swan’s portfolios and prepares stress tests, risk assessment reports and contributes to strategic decision making for the investment management team, as well as serving as an additional layer of oversight for the trading team. As a Chartered Market Technician, he also acts as Chief Technical Strategist at Swan Global Investments.
Swan Global Investments, LLC is a SEC registered Investment Advisor that specializes in managing money using the proprietary Defined Risk Strategy (“DRS”). SEC registration does not denote any special training or qualification conferred by the SEC. Swan offers and manages the DRS for investors including individuals, institutions and other investment advisor firms. Any historical numbers, awards and recognitions presented are based on the performance of a (GIPS®) composite, Swan’s DRS Select Composite, which includes non-qualified discretionary accounts invested in since inception, July 1997, and are net of fees and expenses. Swan claims compliance with the Global Investment Performance Standards (GIPS®).
All Swan products utilize the Defined Risk Strategy (“DRS”), but may vary by asset class, regulatory offering type, etc. Accordingly, all Swan DRS product offerings will have different performance results due to offering differences and comparing results among the Swan products and composites may be of limited use. All data used herein; including the statistical information, verification and performance reports are available upon request. The S&P 500 Index is a market cap weighted index of 500 widely held stocks often used as a proxy for the overall U.S. equity market. Indexes are unmanaged and have no fees or expenses. An investment cannot be made directly in an index. Swan’s investments may consist of securities which vary significantly from those in the benchmark indexes listed above and performance calculation methods may not be entirely comparable. Accordingly, comparing results shown to those of such indexes may be of limited use. The adviser’s dependence on its DRS process and judgments about the attractiveness, value and potential appreciation of particular ETFs and options in which the adviser invests or writes may prove to be incorrect and may not produce the desired results. There is no guarantee any investment or the DRS will meet its objectives. All investments involve the risk of potential investment losses as well as the potential for investment gains. Prior performance is not a guarantee of future results and there can be no assurance, and investors should not assume, that future performance will be comparable to past performance. All investment strategies have the potential for profit or loss. Further information is available upon request by contacting the company directly at 970–382-8901 or www.www.swanglobalinvestments.com. 097-SGI-021518