If 2017 was “the best of times,” then February 2018 was “the worst of times”—at least in the volatility markets. During the first week of February what was previously all quiet on the volatility front quickly turned to “Volmageddon.” Market participants who had been lulled for so long with the low volatility environment of 2017 were reminded how quickly things can change.
In “A Tale of Two Volatilities, Part 1,” we explored how option implied volatility can actually rise when the market is moving quickly higher and setting new highs. This follow-up will evaluate what occurred the first week of February 2018, how volatility strategies fared, and the new volatility regime we have now entered.
On February 5, 2018, on the heels of rising rate expectations, the S&P 500 dropped 4.1% recording its largest one-day move since 2011. This ended 300 trading days without a downward move of more than -2% in the index. The VIX, in turn, recorded its largest-ever percentage increase (115%) closing at 37.32 from the previous day’s close at 17.31. Additionally, stock correlations increased and reached their highest levels since August 2015.
Let’s begin by examining what happened to the volatility skew as the market sold off in early February. Remember from Part 1 that skew is the relative difference in pricing between downside strikes (moneyness less than 100%) and upside strikes (moneyness greater than 100%). The general theme in January was that of a declining skew as investors implemented stock replacement strategies via upside calls and overwriters were forced to cover their short call positions due to the speed of the market’s rally. The demand for upside calls increased with a rapidly rising market.
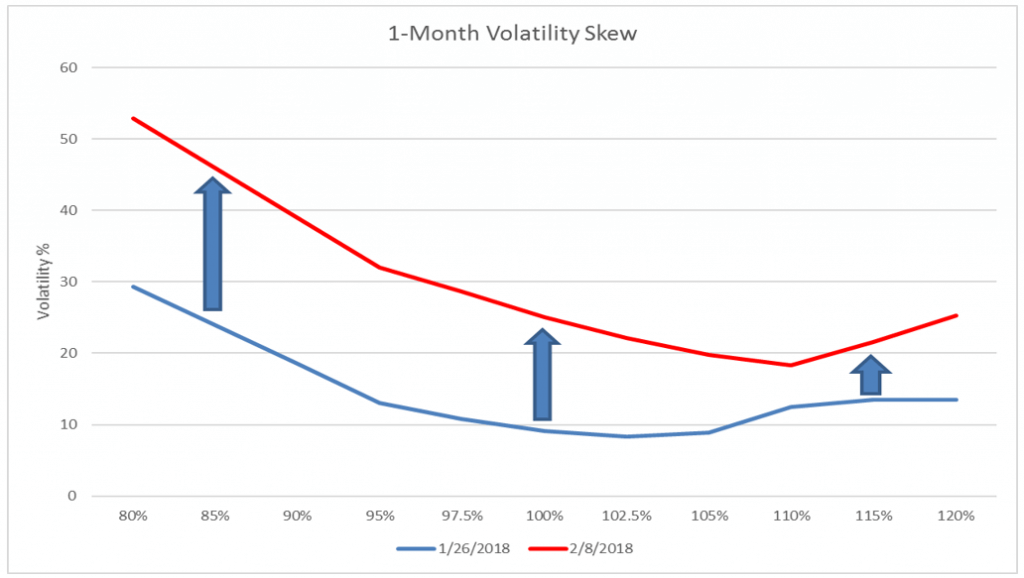
Things reversed dramatically in February. The graph below compares the skew curve from January 26 to the shape of the same skew curve from February 8, 2018.

Source: Bloomberg, Swan Global Investments
The graph above shows two things. First, there was an increase in overall volatility. This equates to ALL options increasing in value as a function of increased demand for option premium across the spectrum. Secondly, there was a marked increase in skew. In other words, not only was there an increase in demand across the board for option premium, but there was a relative increase in demand for downside puts as investors rushed to purchase protection as the markets sold off.
To showcase this further, the 25-delta put-call skew we saw on January 26 had traded in the 22nd percentile over the last 5 years. Meaning, over the last 5 years, 78% of all observations had skew trading higher. On February 8, 2018, that percentile had increased to the 100th percentile.
So, what was the cause of the extreme movement in volatility? First, there was a deleveraging from the risk control/risk parity community. These strategies target a specific volatility or equity ratio and must rebalance their portfolios with market movements. For example, a short gamma strategy must buy volatility as volatility is increasing or sell equities as equities are decreasing. As we witnessed, these moves can happen extremely quickly and have costly effects
On February 5, inverse short VIX products were forced to rebalance their portfolios near the market close and in the after-hours market. This can result in a costly rebalance. For instance, suppose you have a $100 portfolio and you want short VIX exposure with 1x leverage. This requires selling $100 of VIX futures. Now suppose the VIX increases and the exposure is now $150. The short VIX portfolio is now worth only $50 making you 3x levered. To de-lever, the portfolio requires purchasing $100 of risk to maintain the 1x exposure desired. The more the VIX increased, the more risk needs to be purchased to maintain the desired exposure.
As the markets sold-off in February with the steep rise in option volatility, there was an exceptional amount of VIX futures purchased, which potentially contributed to the sell-off in S&P futures during that time. The lack of liquidity for VIX futures in the after-market session highlighted the “fragility” of these types of strategies which suffered steep losses. In and of itself, shorting volatility is not a “bad” thing and there are numerous studies and strategies that employ risk premium harvesting to add incremental returns to portfolios. However, shorting volatility while using excessive leverage can quickly become challenging to manage under times of market duress.
And what about realized volatility? Well, realized volatility spiked as well. Risk premia harvesting strategies are based on the premise that over time implied volatility trades higher than what is actually realized in the underlying market. The early February move lower, by one metric, was one of the largest 5-day percent increases in history. The only other times that witnessed greater 5-day realized volatility percentage increases were May-1940, German blitz; May-1948, Israel independence declared; and October-1987, Black Monday crash (Source: Bank of America Merrill Lynch).
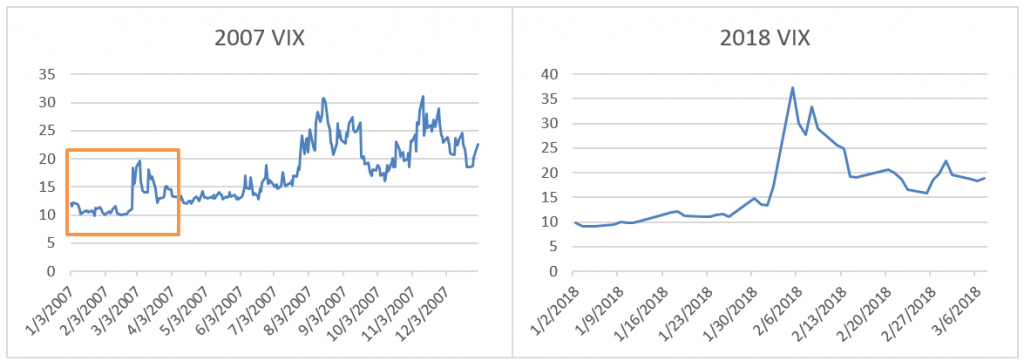
What does all this mean going forward? In previous writings, we’ve made the case that volatility tends to trade in “regimes”—i.e., low-vol, mid-vol, and high-vol environments. Undoubtedly, 2017 was a low-vol regime. However, a tremendous amount of short-gamma is now out of the market. The catalysts for another spike in the VIX of the likes just witnessed have been diminished, at least in the near-term. Market sell-offs from this point should be more “orderly” in keeping the VIX in its new volatility regime.
As we can see from the graphs below, the start of 2018 for the VIX looks quite similar to that of 2007 when the 2004-2006 low volatility period came to an end.

Source: Bloomberg, Swan Global Investments
Throw in tax cuts, tariffs, and possible trade wars, don’t expect the VIX to see single digits anytime soon.
Chris Hausman, CMT®, Portfolio Manager, Managing Director-Risk, focuses on risk assessment and management for the Defined Risk Strategy investments and positions. He monitors risk across all of Swan’s portfolios and prepares stress tests, risk assessment reports and contributes to strategic decision making as part of the investment management team, as well as serving as an additional layer of oversight for the trading team. As a Chartered Market Technician, he also acts as Chief Technical Strategist at Swan Global Investments.
Swan Global Investments, LLC is a SEC registered Investment Advisor that specializes in managing money using the proprietary Defined Risk Strategy (“DRS”). SEC registration does not denote any special training or qualification conferred by the SEC. Swan offers and manages the DRS for investors including individuals, institutions and other investment advisor firms. Any historical numbers, awards and recognitions presented are based on the performance of a (GIPS®) composite, Swan’s DRS Select Composite, which includes non-qualified discretionary accounts invested in since inception, July 1997, and are net of fees and expenses. Swan claims compliance with the Global Investment Performance Standards (GIPS®).
All Swan products utilize the Defined Risk Strategy (“DRS”), but may vary by asset class, regulatory offering type, etc. Accordingly, all Swan DRS product offerings will have different performance results due to offering differences and comparing results among the Swan products and composites may be of limited use. All data used herein; including the statistical information, verification and performance reports are available upon request.
The MSCI (Morgan Stanley Capital International) EAFE index comprises the MSCI country indexes capturing large and mid-cap equities across developed markets, excluding the U.S. and Canada. The MSCI(Morgan Stanley Capital International) Emerging Markets Index is designed to measure equity market performance in global emerging markets. Indexes are unmanaged and have no fees or expenses. An investment cannot be made directly in an index. Swan’s investments may consist of securities which vary significantly from those in the benchmark indexes listed above and performance calculation methods may not be entirely comparable. Accordingly, comparing results shown to those of such indexes may be of limited use. The adviser’s dependence on its DRS process and judgments about the attractiveness, value and potential appreciation of particular ETFs and options in which the adviser invests or writes may prove to be incorrect and may not produce the desired results. There is no guarantee any investment or the DRS will meet its objectives. All investments involve the risk of potential investment losses as well as the potential for investment gains. Prior performance is not a guarantee of future results and there can be no assurance, and investors should not assume, that future performance will be comparable to past performance. All investment strategies have the potential for profit or loss. Further information is available upon request by contacting the company directly at 970–382-8901 or www.www.swanglobalinvestments.com. 118-SGI-030918