The Cboe’s VIX Index is without a doubt the most referenced metric when it comes to characterizing the general state of market volatility making it the go-to measurement for market volatility.
However, the VIX as a predictor of future market movement has suffered in recent years, and many incorrectly interpret this as that it simply does not work anymore. While we disagree with the idea that the VIX is “broken,” we do believe there are some limitations to what it can be used to measure or infer about overall market risk exposure.
Any options trader or portfolio manager will tell you it’s best to have a few tools in the tool box to really ascertain risk. This blog will review some of the lesser known measurements of risk that, in conjunction with the VIX, can help paint a better, more complete depiction of what risk lies ahead, option risks, and whether pricing is high or low for a given structure.
The VIX is still a valuable tool for measuring investor sentiment in the overall market and despite its criticisms and controversies, still very popular. Its popularity stems from a simple and understandable rubric, and a catchy nickname: “the fear gauge.” This has helped garner its “celebrity” status among any single stock name or equity index product. Yet, the VIX has gone through its own transformation over the years and has even been involved in its own celebrity-type controversy.
However, it does have its critics. Some have even gone as far to say the calculation is broken and no longer the accurate market predictor it once was. This may be due to a multitude of factors—systematic strategies such as risk parity, volatility targeting, machine learning, and exchange traded products—that have changed the investment landscape, especially with respect to volatility.
The VIX continues to measure what it was always designed to measure: supply and demand of S&P 500 (SPX) options. The VIX can be used as a barometer for how much portfolio protection is being purchased via SPX options, or how much fear there is in the market. Risk mitigation can be purchased for hedging downside market movements or upside movements for participating in market gains. If the VIX is low, then we are in what is known as a “soft market” for hedging portfolios and vice versa.
This is where it all began. The VXO is the old VIX calculated on S&P 100 (OEX) options, rather than S&P 500 (SPX) options. At one point in time, it was the most active index option product before being usurped by the SPX.
The VXO calculation is slightly different than the current VIX: the VXO only takes a couple of strikes above and below the index price using a short and longer-term maturity to interpolate an option with 30 calendar days to expiry while the VIX uses a strip of options and adds an element of skew in the pricing mechanism. This essentially removes much of the range of volatility dispersion between downside and upside strikes and instead represents a more focused view of pure volatility by using strikes that are closer to being at-the-money. At the money options are viewed as “skewless.” Therefore, their volatility will not be influenced by supply and demand forces that an options model attempts to predict up and down the strike spectrum.
If one does wish to measure the skewness of the strike distribution there are multiple ways to do so. The most popular is taking the difference between the 25 delta put and 25 delta call or the difference between the 90% moneyness strike against the 110% strike volatility with the same maturity. The goal of such skew measures is to approximate the flow of option supply and demand across the volatility curve.
In general, when markets move lower, volatility will increase, but skew decreases (skew can increase in the short-term for abnormal shocks). The basic order flow when the market is moving lower is to buy downside put spreads and sell upside call spreads as positions are being rolled down. These are known as skew “flattener” trades. In contrast, the basic order flow when the market is moving higher and volatility is declining is to sell downside put spreads and buy upside call spreads as positions are being rolled up. These are known as skew “steepener” trades. This provides a better understanding of the current pulse of the market.
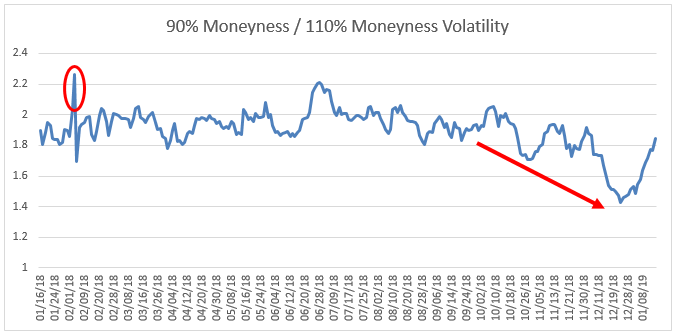
Source: Bloomberg
The graph above shows a marked increase between the volatility of the 90% moneyness strike in relation to the 110% moneyness strike during the February volatility spike episode, which many now view as an isolated event. Once the market resumed its upward trajectory, skew remained elevated until the fourth quarter sell-off where you can see a skew collapse. Skew has now begun to pick up with the recent 8%+ post-Christmas rally.
This index measures SPX tail risk or moves that are outside two standard deviations. It does not measure skew in the traditional sense that option traders and market makers are accustomed to but approaches it from a statistical perspective. When SKEW increases, it shows there is more demand for very out of the money options and better reflects the markets perception of tail risk, or a large downside move.
This also shows how cheap or expensive hedging against a tail risk event might be. When the index is cheap, it might be a good time to look for inexpensive tail hedges.
This indicator measures investor sentiment by pricing 3-month zero-cost collars. It measures how much downside hedging costs. The collar begins by selling a 3-month 10% out of the money call and using the proceeds to purchase an out of the money put with the same maturity. The distance between the underlying spot price and the out of the money put is used to calculate the index. The higher the reading, the higher the cost of downside hedging relative to out of the money calls. Unlike the moneyness methodology, the put strike is allowed to slide based on the premium collected for selling a 110% strike call.
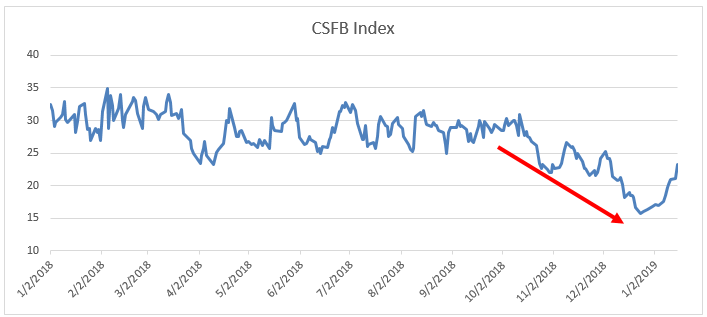
Source: Bloomberg
A stock investor will use many tools when forecasting a stock price, such as earnings growth, market sentiment, and broad economic trends. A bond investor takes into account multiple factors, such as interest rates, credit risk, liquidity, and prepayment risk. Option investors are no different. Relying on a single factor like the VIX will paint a narrow picture of risk, potentially leaving option investors vulnerable to hazardous blind spots. These other metrics help paint a more complete picture of the options market.
This post focused on skew measurements, basic order flow, and the interaction between market movement and volatility. For future posts in this series, we’ll dive into a few other measurements that can help an investor or portfolio manager determine their overall market exposure.
Chris Hausman, CMT®, Portfolio Manager, Managing Director-Risk, focuses on risk assessment and management for the Defined Risk Strategy investments and positions. He monitors risk across all of Swan’s portfolios and as a member of the Investment Management Committee contributes to strategic decision making as well as serving as an additional layer of oversight for the trading team.
Swan Global Investments, LLC is a SEC registered Investment Advisor that specializes in managing money using the proprietary Defined Risk Strategy (“DRS”). SEC registration does not denote any special training or qualification conferred by the SEC. Swan offers and manages the DRS for investors including individuals, institutions and other investment advisor firms. Any historical numbers, awards and recognitions presented are based on the performance of a (GIPS®) composite, Swan’s DRS Select Composite, which includes non-qualified discretionary accounts invested in since inception, July 1997, and are net of fees and expenses. Swan claims compliance with the Global Investment Performance Standards (GIPS®).
All Swan products utilize the Defined Risk Strategy (“DRS”), but may vary by asset class, regulatory offering type, etc. Accordingly, all Swan DRS product offerings will have different performance results due to offering differences and comparing results among the Swan products and composites may be of limited use. All data used herein; including the statistical information, verification and performance reports are available upon request. The S&P 500 Index is a market cap weighted index of 500 widely held stocks often used as a proxy for the overall U.S. equity market. Indexes are unmanaged and have no fees or expenses. An investment cannot be made directly in an index. Swan’s investments may consist of securities which vary significantly from those in the benchmark indexes listed above and performance calculation methods may not be entirely comparable. Accordingly, comparing results shown to those of such indexes may be of limited use. The adviser’s dependence on its DRS process and judgments about the attractiveness, value and potential appreciation of particular ETFs and options in which the adviser invests or writes may prove to be incorrect and may not produce the desired results. There is no guarantee any investment or the DRS will meet its objectives. All investments involve the risk of potential investment losses as well as the potential for investment gains. Prior performance is not a guarantee of future results and there can be no assurance, and investors should not assume, that future performance will be comparable to past performance. All investment strategies have the potential for profit or loss. Further information is available upon request by contacting the company directly at 970–382-8901 or www.swanglobalinvestments.com. 026-SGI-012219