Options strategies are versatile tools to include in a portfolio, so discounting all options strategies as dangerous and risky because of a few blow ups can be limiting. Examining these blow ups reveal some common areas that advisors can evaluate for when choosing an options strategy.
The three areas where options-strategies get into trouble are leverage, liquidity, and risk controls. In a previous post, we explored the danger excessive leverage can pose to an options-based strategy. In this post we discuss the second of three “smoking guns”: the risks of investing in thinly traded, illiquid options.
Options are just like stocks or bonds in the sense that the liquidity experience can be entirely different depending upon the security. Typically, no one has any problems trading Apple stock or on-the-run U.S. Treasury bonds. However, the bid-ask spreads on a microcap stock or a small-issue, high yield bond can be significant. The same dynamic is true in options.
The table below shows the top five exchange traded options in terms of volume on a randomly selected date (12/14/18). In these instruments, billions of dollars can be traded without any discernible impact on price.
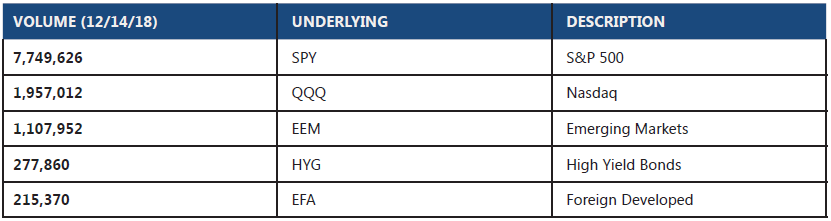
Source: Cboe
On the other hand, options on more obscure underlying assets can be thinly traded and have wide bid-ask spreads. While the profit margin may be bigger, there is a greater liquidity risk when trading these types of securities. Investors who dabble in this space obviously think it is worth it. Just like microcap stocks or high yield bonds, profit opportunities sometimes exist in the less efficient corners of the market.
Looking at recent average daily volume, provided by the Cboe, the vast majority of option volume resides in just a few names. In fact, the top 1% of single stocks that trade options account for approximately 45% of the average daily volume.
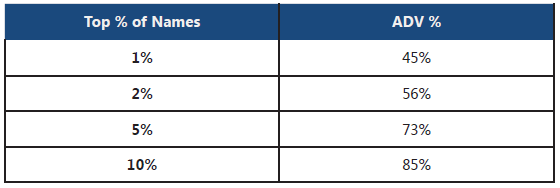
Source: Cboe
If the top 10% of options account for 85% of the average daily trading volume, that means that 90% of the listed options account for only 15% of the average daily volume. Your typical trader is going to be forced to pay more to trade in this long tail of the options market.
However, the problem with liquidity is that it tends to evaporate when you need it most. Even options on some of the most liquid securities, like the SPDR ETF, can see wider bid-ask spreads during large market moves. In periods of market panics or sell-offs, trading in already illiquid securities can grind to a standstill.
Pricing assumptions sourced from normal markets might fail to anticipate just how wide bid-ask spreads can be in a panic, thus dramatically increasing the tail risk in a crisis.
Understanding how liquidity can affect an option strategy is important in setting expectations and understanding the risks. Some questions one might ask are:
Illiquidity tends to mix poorly with leverage and can rupture a strategy’s risk controls. High leverage might force a manager to close out his position right at the time when pricing is at its most unfavorable, compounding losses.
Our next post in the series will cover risk controls and why failing to adhere to them can result in detrimental consequences.
Marc Odo, CFA®, CAIA®, CIPM®, CFP®, Client Portfolio Manager, is responsible for helping clients and prospects gain a detailed understanding of Swan’s Defined Risk Strategy, including how it fits into an overall investment strategy. Formerly, Marc was the Director of Research at Zephyr Associates for 11 years.
Swan Global Investments, LLC is a SEC registered Investment Advisor that specializes in managing money using the proprietary Defined Risk Strategy (“DRS”). SEC registration does not denote any special training or qualification conferred by the SEC. Swan offers and manages the DRS for investors including individuals, institutions and other investment advisor firms. Any historical numbers, awards and recognitions presented are based on the performance of a (GIPS®) composite, Swan’s DRS Select Composite, which includes non-qualified discretionary accounts invested in since inception, July 1997, and are net of fees and expenses. Swan claims compliance with the Global Investment Performance Standards (GIPS®).
All Swan products utilize the Defined Risk Strategy (“DRS”), but may vary by asset class, regulatory offering type, etc. Accordingly, all Swan DRS product offerings will have different performance results due to offering differences and comparing results among the Swan products and composites may be of limited use. All data used herein; including the statistical information, verification and performance reports are available upon request. The S&P 500 Index is a market cap weighted index of 500 widely held stocks often used as a proxy for the overall U.S. equity market. Indexes are unmanaged and have no fees or expenses. An investment cannot be made directly in an index. Swan’s investments may consist of securities which vary significantly from those in the benchmark indexes listed above and performance calculation methods may not be entirely comparable. Accordingly, comparing results shown to those of such indexes may be of limited use. The adviser’s dependence on its DRS process and judgments about the attractiveness, value and potential appreciation of particular ETFs and options in which the adviser invests or writes may prove to be incorrect and may not produce the desired results. There is no guarantee any investment or the DRS will meet its objectives. All investments involve the risk of potential investment losses as well as the potential for investment gains. Prior performance is not a guarantee of future results and there can be no assurance, and investors should not assume, that future performance will be comparable to past performance. All investment strategies have the potential for profit or loss. Further information is available upon request by contacting the company directly at 970-382-8901 or www.swanglobalinvestments.com. 253-SGI-060619