2022 is a year many investors would like to forget. Even those who spread their eggs across many baskets likely noticed many of their positions were negative for the year. What happened?
In this post we will argue 2022’s poor returns were not a surprise and should have been expected. Diversification didn’t just fail in 2022. Diversification has been broken ever since the Global Financial Crisis 15 years ago.
As a risk-mitigation strategy, diversification can only temper volatility if the constituents have low or negative correlations. If all the asset classes one invests in are moving in lock-step, then it doesn’t matter how many asset classes are used in a portfolio and diversification won’t lower risk. Certainly, this was the case in 2022.
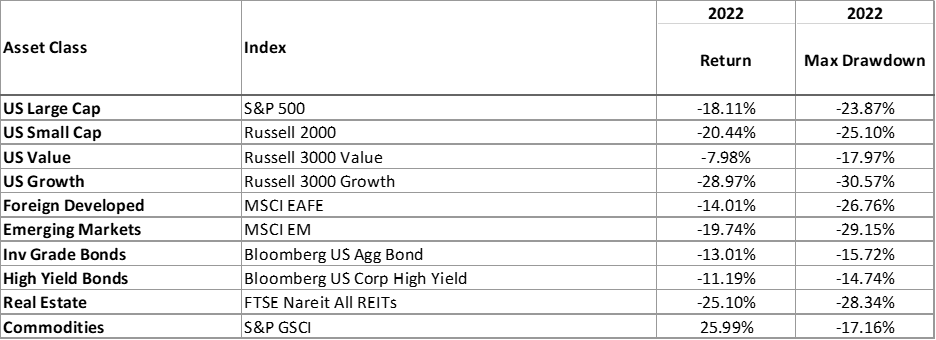
The table below shows the 2022 returns of ten major asset classes.

Source: Morningstar Direct
The table below shows the correlation matrix for 2022.
 Source: Morningstar Direct
Even investment grade bonds, traditionally the “ballast” of a portfolio, were highly correlated to other asset classes and down significantly in 2022. Only commodities posted positive returns, after many years of disappointment. Some commentators called this “the everything bear market.”
When everything is down, the only thing that is up is correlations.
Our portfolio managers and analysts are dedicated to creating relevant, educational Articles, Podcasts, White Papers, Videos, and more.
The problem is that this isn’t a recent phenomenon. Prior to the “everything bear market” was the “everything bull market” when many of the same asset classes were up in synchronicity. And before that was the Covid-19 sell-off when investors were selling everything in a blind panic.
The first table below shows the cumulative return for the latest three-year period, ending December 31st, 2022. Next to that are the returns within those years: 1) the Covid Panic, 2) the post-Covid “everything bull market” and 3) 2022’s “everything bear market.”

Source: Morningstar Direct
Below is a correlation matrix for the three-year period.

Source: Zephyr StyleADVISOR
This information illustrates diversification has been of limited value over the last three years since so many of the world’s asset classes were moving in a highly correlated fashion. The idea behind diversification is that some assets should zig when the others zag, but for the last three years that hasn’t been the case.
In fact, this has been going on ever since the Global Financial Crisis of 2007-09. The correlation matrix below covers the last decade and a half.

Source: Zephyr StyleADVISOR
During the cataclysmic bear market of the Global Financial Crisis, many of the above asset classes lost over half their value. Following the GFC was one of the longest bull markets in history. While markets suffered a few corrections, there wasn’t a 20% sell-off for over a decade. Correlations were high during this long bull market, but nobody cared because markets were up.
To find a period where correlations were low and diversification offered true risk reduction, one has to look at the period preceding the Global Financial Crisis. While the markets were mostly up during this 20-year period, the various asset classes were not as highly synchronized and the case for diversification was much stronger.

Source: Zephyr StyleADVISOR
Harry Markowitz is often credited with being the grandfather of “Modern Portfolio Theory”, where he mathematically proved that low correlations can reduce overall portfolio volatility. For years, diversification was described as a “free lunch.”
So what changed? Why were the benefits of diversification so reduced following the Global Financial Crisis? Where did that “free lunch” go?
We would argue that it was during and following the Global Financial Crisis that the Federal Reserve Bank and other central banks fully embraced and normalized activist monetary policies. Officially the Fed has a dual mandate to keep unemployment low and prices stable, but following the GFC it seemed additional goals were incorporated into their thinking: to keep asset levels high and shield investors from losses.
While the Fed had been prone to “mission creep” ever since the Black Monday crash of 1987, previously the tools employed were more traditional. Either the Fed would provide short-term liquidity backstops (e.g. the Mexican Peso Crisis of 1994 and the Long Term Capital Management Crisis of 1998) or adjust the Fed Funds Rate up or down to affect lending (most notably following the Dot-Com Crash of 2000-02).
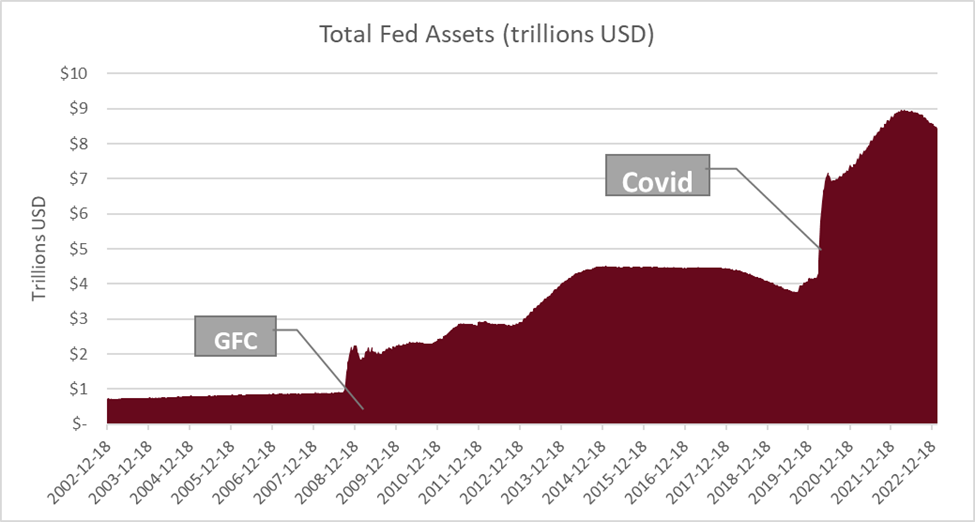
However, those traditional tools were insufficient to deal with the scope and scale of the devastation of the Global Financial Crisis, so the Fed turned to more extreme means. The Fed fully embraced the idea of “Quantitative Easing” or artificially suppressing interest rates by issuing trillions of dollars of debt and having the Federal Reserve purchase that debt.

The Fed kept this debt on its balance sheet for over a decade. When they finally started taking the initial baby steps to start reducing this mountain of debt, the global economy was hit by another existential crisis: the Covid-19 pandemic. Once again, the world’s central banks issued trillions of dollars of new debt as economies around the world shut down. This, coupled with additional trillions of fiscal stimuli, resulted in a flood of liquidity.
This liquidity had to go somewhere. In fact, it flowed everywhere. It flowed into equities. It flowed into bonds. It flowed into real estate and commodities and housing and cryptocurrencies. It fueled the post-GFC bull market as well as the post-Covid bull market. It drove markets- and correlations- higher. And it killed the effectiveness of diversification.
So where do we go from here? Will correlations return to their pre-GFC levels now that the Fed is draining liquidity from the system to combat inflation? Will diversification once again be a useful tool? Will Modern Portfolio Theory become “retro-cool”?
In our opinion, the risks to investors are too great if they turn out to be wrong about a diversification revival. The Fed still has trillions of dollars on its balance sheet. The Federal government is still running huge annual deficits financed with debt issuance. Entitlement spending is still scheduled to explode in the coming decades.
So how does one construct portfolios to pursue return while also mitigating risk if nearly all asset classes are highly correlated?
At Swan Global Investments, we believe hedging to be a more effective and direct form of risk management. Recognizing the historic correlation convergence in times of market stress, we have incorporated inversely correlated instruments in our hedged equity strategies since 1997.
For example, put options are reliably inversely correlated to the underlying security. So our Defined Risk Strategy is a hedged equity approach that maintains passive equity market exposure via broad equity index ETFs for long-term growth while actively managing risk with long-term put options to directly mitigate market risk.
Building portfolios with strategies that incorporate inversely correlated components may provide a solution to the correlation conundrum. Hedged equity strategies may be a tool investors can use to help navigate market uncertainty and provide true diversification in times of market crisis.
Marc Odo, CFA®, FRM®, CAIA®, CIPM®, CFP®, Client Portfolio Manager, is responsible for helping clients and prospects gain a detailed understanding of Swan’s Defined Risk Strategy, including how it fits into an overall investment strategy. His responsibilities also include producing most of Swan’s thought leadership content. Formerly Marc was the Director of Research for 11 years at Zephyr Associates.
Our portfolio managers and analysts are dedicated to creating relevant, educational Articles, Podcasts, White Papers, Videos, and more.
Swan Global Investments, LLC is a SEC registered Investment Advisor that specializes in managing money using the proprietary Defined Risk Strategy (“DRS”). SEC registration does not denote any special training or qualification conferred by the SEC. Swan offers and manages the DRS for investors including individuals, institutions and other investment advisor firms.
All Swan products utilize the Defined Risk Strategy (“DRS”), but may vary by asset class, regulatory offering type, etc. Accordingly, all Swan DRS product offerings will have different performance results due to offering differences and comparing results among the Swan products and composites may be of limited use. All data used herein; including the statistical information, verification and performance reports are available upon request. The S&P 500 Index is a market cap weighted index of 500 widely held stocks often used as a proxy for the overall U.S. equity market. The Bloomberg US Aggregate Bond Index is a broad-based flagship benchmark that measures the investment grade, US dollar-denominated, fixed-rate taxable bond market. The index includes Treasuries, government-related and corporate securities, MBS (agency fixed-rate and hybrid ARM pass-throughs), ABS and CMBS (agency and non-agency). Indexes are unmanaged and have no fees or expenses. An investment cannot be made directly in an index. Swan’s investments may consist of securities which vary significantly from those in the benchmark indexes listed above and performance calculation methods may not be entirely comparable. Accordingly, comparing results shown to those of such indexes may be of limited use. The adviser’s dependence on its DRS process and judgments about the attractiveness, value and potential appreciation of particular ETFs and options in which the adviser invests or writes may prove to be incorrect and may not produce the desired results. There is no guarantee any investment or the DRS will meet its objectives. All investments involve the risk of potential investment losses as well as the potential for investment gains. Prior performance is not a guarantee of future results and there can be no assurance, and investors should not assume, that future performance will be comparable to past performance. Further information is available upon request by contacting the company directly at 970-382-8901 or www.swanglobalinvestments.com. 044-SGI-021723