This site uses cookies. By continuing to browse the site, you are agreeing to our use of cookies. Privacy Policy
Okay, thanksIn a previous post we discussed the pain index as a better measure of risk. The pain index measures the depth, duration, and frequency of losses for an investment.
But what about the upside?
If there is one drawback of the pain index, it is it only measures risk, not return. If one wanted to have the lowest possible pain index of 0.0% and never lose a cent, one would keep all of their money in a FDIC insured savings account.
Most investors accept the fact that some risk must be undertaken in order to generate any decent amount of return. This is where the Pain Ratio comes in.
Developed by Dr. Thomas Becker and Aaron Moore of Zephyr Associates, the pain ratio takes advantage of the innovations of the pain index. The mathematic equation for the pain ratio is:
Pain Ratio = (AnnRtn(r1,..,r2) -(AnnRtn(c1,..,c2) / Pain Index(r1,..,r2)
where:
r1,..,r2 = manager return series
c1,..,c2 = cash equivalent return series
This measurement should look somewhat familiar as it uses the Sharpe ratio as a template.
The Sharpe ratio is one of the most well-known and widely used performance measures. William Sharpe developed it over half a century ago and attempts to measure how much reward is obtained per unit of risk, with risk defined in terms of standard deviation, or volatility.
Volatility was the primary measure of risk when academia first started getting serious about measuring and quantifying risk and return. This is where the Pain Ratio differs by using the drawdown, or Pain Index, in its calculations instead.
The Pain Ratio provides a better assessment for understanding the amount of return per unit of risk, measured in terms of capital preservation.
There are many variations to the basic return-divided-by risk concept, like Sharpe ratio, Treynor ratio, Sortino ratio, information ratio and many others.
Like all ratios, the higher the pain ratio the better, since return is in the numerator and risk in the denominator.
In order to ascertain what a “good” number is, one must compare against the pain ratios of peers or asset class indices. The graphs below show the two components of the pain ratio comparing the Defined Risk Strategy (DRS) to the S&P 500.
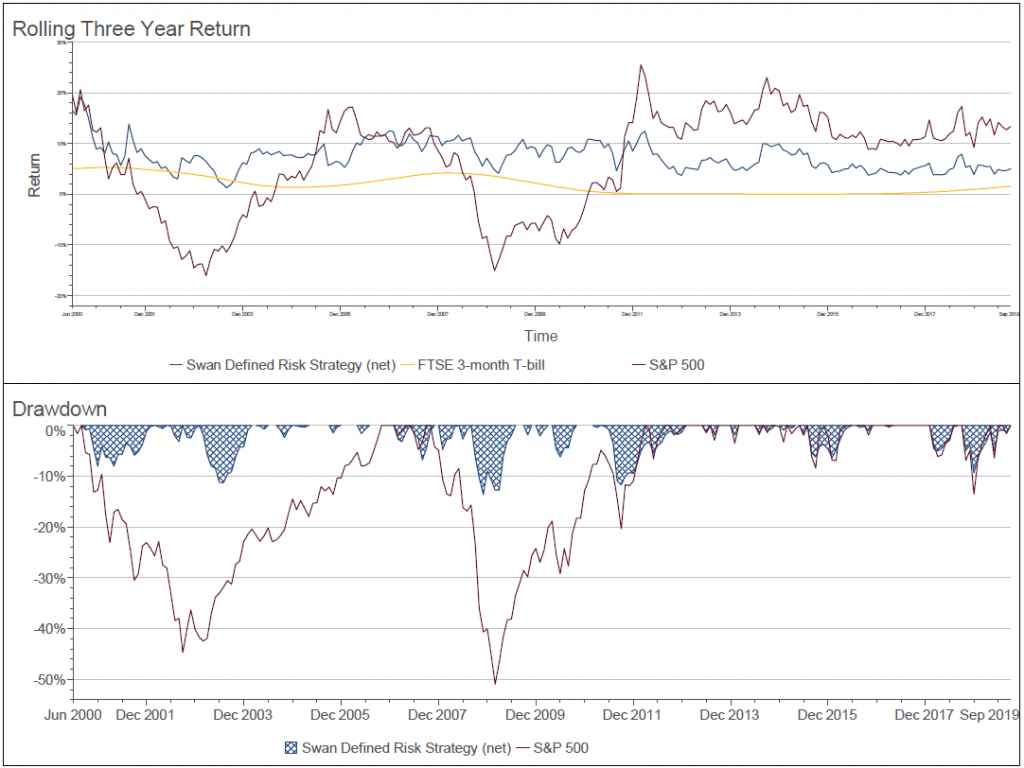
Source: Zephyr StyleADVISOR. The S&P 500 Index is an unmanaged index, and cannot be invested into directly. Swan DRS returns are from the Select Composite, net of all fees. NOTE – this chart is for illustration purposes, not a guarantee of future performance. The charts and graphs contained herein should not serve as the sole determining factor for making investment decisions.
The upper graph represents the numerator, the excess return over the risk-free rate. The risk-free rate is in yellow while the Swan DRS is the blue line and the S&P 500 index is the dark red line. The graph illustrates the rolling three-year return differential versus the risk-free rate.
The bottom graph is the denominator of the equation. The pain ratio uses the pain index as its measure of risk. The graph illustrates the depth, duration, and frequency of losses. Once again, the DRS is in blue and the S&P 500 Index in dark red.
Working through the numbers, we can see that the Swan DRS risk/return trade-off is much superior to the S&P 500 Index. Swan wins on both measures- the return has been higher and the risk lower. The pain ratio is 2.64 for the DRS vs. 0.52 for the S&P 500 Index during the period July 1997 to September 2019.
When analyzing the pain ratio, the higher the value the better.
The pain ratio and the pain index deliver measurements that are related to an investor’s objective to minimize losses. Both metrics are easier for investors to understand because they are connected to what they care about in a more concrete way.
One of the goals of the DRS is to help manage risk and preserve capital, so the pain ratio highlights the strengths of the Swan DRS.
The vast majority of Swan DRS’s holdings are in broad market ETFs, giving the strategy upside potential. Typically, 10-15% of the DRS’s holdings are in hedges to protect on the downside.
The trade-off between return and risk of this strategy are well illustrated in the pain ratio.
Marc Odo, CFA®, CAIA®, CIPM®, CFP®, Client Portfolio Manager, is responsible for helping clients and prospects gain a detailed understanding of Swan’s Defined Risk Strategy, including how it fits into an overall investment strategy. Formerly Marc was the Director of Research for 11 years at Zephyr Associates.
Swan Global Investments, LLC is a SEC registered Investment Advisor that specializes in managing money using the proprietary Defined Risk Strategy (“DRS”). SEC registration does not denote any special training or qualification conferred by the SEC. Swan offers and manages the DRS for investors including individuals, institutions and other investment advisor firms. Any historical numbers, awards and recognitions presented are based on the performance of a (GIPS®) composite, Swan’s DRS Select Composite, which includes nonqualified discretionary accounts invested in since inception, July 1997, and are net of fees and expenses. Swan claims compliance with the Global Investment Performance Standards (GIPS®). All data used herein; including the statistical information, verification and performance reports are available upon request. The S&P 500 Index is a market cap weighted index of 500 widely held stocks often used as a proxy for the overall U.S. equity market. Indexes are unmanaged and have no fees or expenses. An investment cannot be made directly in an index. Swan’s investments may consist of securities which vary significantly from those in the benchmark indexes listed above and performance calculation methods may not be entirely comparable. Accordingly, comparing results shown to those of such indexes may be of limited use. The adviser’s dependence on its DRS process and judgments about the attractiveness, value and potential appreciation of particular ETFs and options in which the adviser invests or writes may prove to be incorrect and may not produce the desired results. There is no guarantee any investment or the DRS will meet its objectives. All investments involve the risk of potential investment losses as well as the potential for investment gains. This analysis is not a guarantee or indication of future performance. Prior performance is not a guarantee of future results and there can be no assurance, and investors should not assume, that future performance will be comparable to past performance. All investment strategies have the potential for profit or loss. Further information is available upon request by contacting the company directly at 970.382.8901 or visit www.swanglobalinvestments.com. 459-SGI-121019