This site uses cookies. By continuing to browse the site, you are agreeing to our use of cookies. Privacy Policy
Okay, thanksIn a previous blog post, we compared the risk-return characteristics of the Swan Defined Risk Strategy (DRS) against traditional and alternative bond strategies. The idea was to illustrate how the DRS, with its focus on capital preservation, has performance metrics similar to the multi-sector and non-traditional bond funds that have been making their way into investor portfolios.
But beyond capital preservation, what about the other role bonds have traditionally performed within a portfolio, that of producing income? Since the Great Financial Crisis, it has been the lack of yield in traditional fixed income that had pushed investors to multi-sector and non-traditional bonds in the first place.
A successful money manager might be in business for decades. Alternatively, successful insurance companies have been around for centuries. Ultimately, an insurance company bears the risk of policy claims, and its balance sheet must be strong enough to withstand those claims when they come in. A successful insurance company must invest their assets well, be very cognizant of the probabilities of unfavorable outcomes, and generate sufficient revenue in order to stay in business. Suffice to say, a hit of 30% or more to its balance sheet could be catastrophic.
Many of those insurance principles are seen in the DRS:
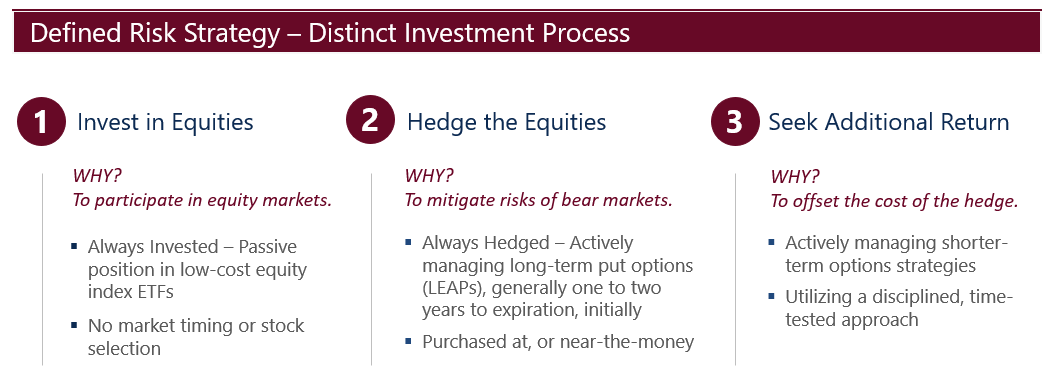
These three primary building blocks are complementary and seek to provide a source of returns in just about any market environment. After all, the market can do one of three things: it can go up, it can go down, or it can stay flat.

It can be said with a high degree of certainty that in no environment will all three components positively contribute to performance. However, in any given environment, at least one, if not two, of the three components may contribute positively to the DRS.
This, of course, is by design and is a manifestation of a truly diversified strategy.
To dampen overall portfolio volatility, the individual components need to have a low or negative correlation. Historically speaking, the hedge component has been negatively correlated to both the equity position and the income trades, and the income trades have had a low correlation to the equity stake.
Because the DRS has historically been limited to single-digit losses in its worst years and has had meaningful participation in up markets, one could make the case it fulfills the role of a distribution vehicle in a portfolio.
To be clear, the DRS does not generate yield like a traditional bond fund with a monthly distribution. Instead, the DRS can be used within a systematic withdrawal plan.
Historically, one could have safely liquidated a percentage of their DRS holdings to generate cash and yet not endanger principal. In fact, if someone implemented a systematic withdrawal plan with the DRS at its inception, the principal value of a DRS investment still grew.
Setting the Scene
Let us walk through a simple, hypothetical scenario:
Due to inflation, the original $50,000 withdrawal grows to $77,392 by the end of 2021.
At the end of the simulation on December 31st, 2021, an aggregate $1,519,640 had been withdrawn from each option. However, the ending values were quite different:
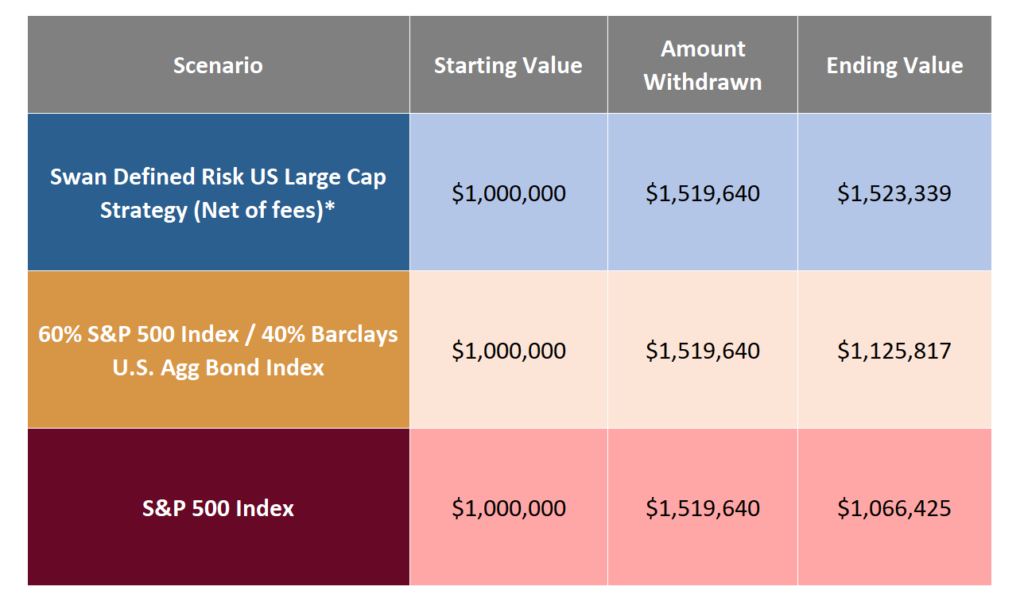
Source: Zephyr StyleADVISOR and Swan Global Investments. *Based on historic performance of the Swan Defined Risk U.S. Large Cap Composite (Swan DRS) from January 1998 through December 2021. Indices are unmanaged and cannot be invested into directly. Past performance is no guarantee of future results.
How is this possible? How can the ending values be so different? Let’s take a look at each investment, starting with the S&P 500.
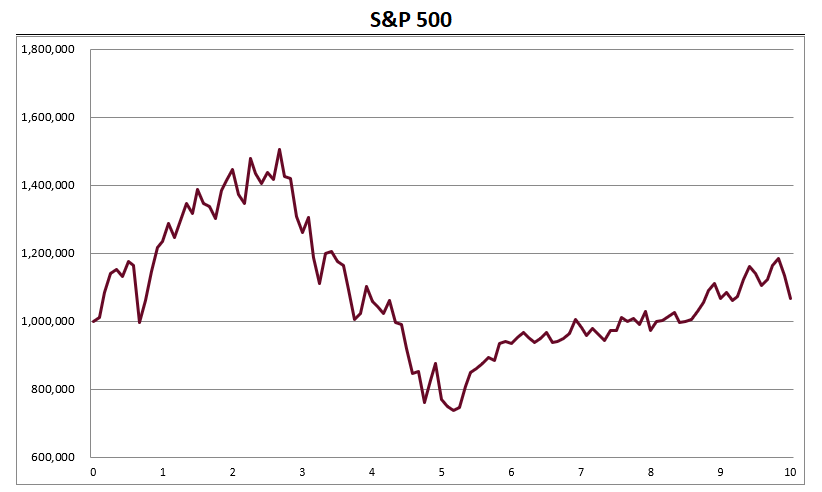
In the graph below, the burgundy line represents the fluctuation in the account balance, while taking out systematic annual withdrawals of $50K, compounded by a 2% annual inflation rate.
While usually stated in percentage terms, here we see gains and losses stated in terms that most people care about: the account balance over time. In other words, will my money last?!
Source: Zephyr StyleADVISOR & Swan Global Investments. Indices are unmanaged and cannot be invested into directly. Past performance is no guarantee of future results. The charts and graphs contained herein should not serve as the sole determining factor for making investment decisions.
When someone says the S&P 500 lost 37% in 2008, what does that really mean?
In the context of this scenario, the $312,352 losses in the account in 2008 represents over four years of spending. The three-year bear market of 2000-02 was arguably worse since it lasted longer and the market took longer to recover. The unrealized losses were $485,097 and withdrawals of $191,042 were taken out over those three years.
Although markets did rally between 2003 and 2007, the portfolio had been seriously impaired by those severe and lengthy bear markets.
Is a bull market enough to cover these losses?
The above analysis is sobering. Please keep in mind that the bull market in U.S. stocks was the second longest on record, and the S&P 500 was up over 400%, from March 2009 to February 2020. However, through this amazing bull market, the portfolio account balance was slightly higher.
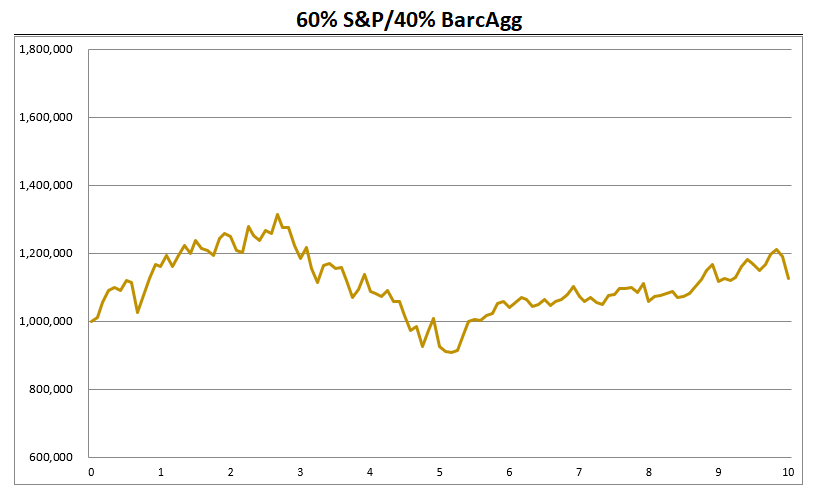
The story isn’t much different with the balanced 60/40 portfolio. Although the highs aren’t as high, and lows aren’t as low, the general picture remains the same.
Source: Zephyr StyleADVISOR & Swan Global Investments. Indices are unmanaged and cannot be invested into directly. Past performance is no guarantee of future results. The charts and graphs contained herein should not serve as the sole determining factor for making investment decisions.
A “glass-half-full” optimist would argue that the portfolio has maintained the withdrawals and is holding up well during the distribution stage. Conversely, a “glass-half-empty” pessimist would wonder how many more years of spending the portfolio could maintain and would be rightfully frightened of another bear market sell-off.
Finally, we see the same scenario using the Defined Risk Strategy. In the 24 years of this study, the Defined Risk U.S. Large Cap Composite has only had five years of losses and weathered the 2000-2002 and 2007-2009 bear markets fairly well.
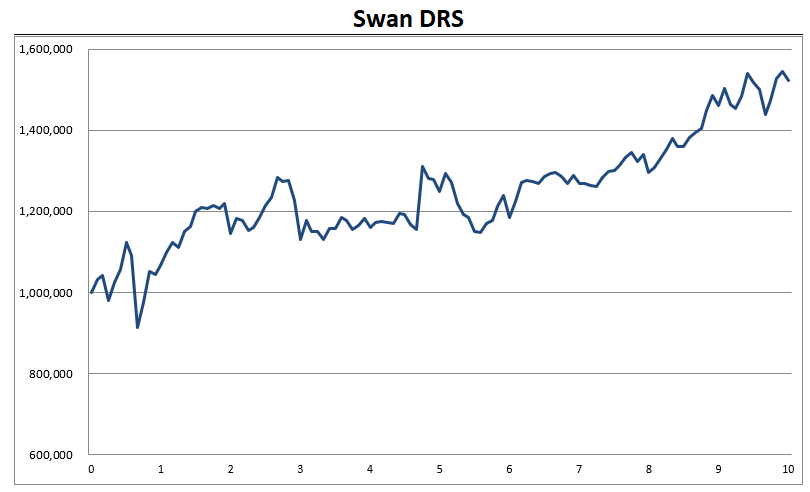
Source: Zephyr StyleADVISOR & Swan Global Investments. Indices are unmanaged and cannot be invested into directly. Past performance is no guarantee of future results. Swan DRS results are from the Defined Risk U.S. Large Cap Composite, net of fees, as of 12/31/2021. The charts and graphs contained herein should not serve as the sole determining factor for making investment decisions.
The worst calendar year in the DRS’s history was 2018 when it was down -6.83%. While combined with an annual withdrawal of over$74,297, the portfolio was able to absorb the hit and support continued withdrawals.
Most importantly, the DRS was able to grow its account value throughout the course of this simulation while maintaining the same levels of withdrawals as the S&P 500 and the 60/40.
The Swan DRS can serve various roles in a portfolio. We have made the case for how this unique investment approach can serve investors looking to accumulate wealth and those needing cash-flow or distributions to live on in retirement.
We will continue the Where the DRS Fits blog series in future posts examining how the Swan DRS can be applied to multiple asset classes.
(Originally published 6/29/2017, Updated 8/13/2018 )
Marc Odo, CFA®, CAIA®, CIPM®, CFP®, Client Portfolio Manager, is responsible for helping clients and prospects gain a detailed understanding of Swan’s Defined Risk Strategy, including how it fits into an overall investment strategy. Formerly Marc was the Director of Research for 11 years at Zephyr Associates.
Swan Global Investments, LLC is a SEC registered Investment Advisor that specializes in managing money using the proprietary Defined Risk Strategy (“DRS”). SEC registration does not denote any special training or qualification conferred by the SEC. Swan offers and manages the DRS for investors including individuals, institutions and other investment advisor firms. Any historical numbers, awards and recognitions presented are based on the performance of a (GIPS®) composite, Swan’s DRS Select Composite, which includes non-qualified discretionary accounts invested in since inception, July 1997, and are net of fees and expenses. Swan claims compliance with the Global Investment Performance Standards (GIPS®).
All Swan products utilize the Defined Risk Strategy (“DRS”), but may vary by asset class, regulatory offering type, etc. Accordingly, all Swan DRS product offerings will have different performance results due to offering differences and comparing results among the Swan products and composites may be of limited use. All data used herein; including the statistical information, verification and performance reports are available upon request.
The MSCI (Morgan Stanley Capital International) EAFE index comprises the MSCI country indexes capturing large and mid-cap equities across developed markets, excluding the U.S. and Canada. The MSCI(Morgan Stanley Capital International) Emerging Markets Index is designed to measure equity market performance in global emerging markets. Indexes are unmanaged and have no fees or expenses. An investment cannot be made directly in an index. Swan’s investments may consist of securities which vary significantly from those in the benchmark indexes listed above and performance calculation methods may not be entirely comparable. Accordingly, comparing results shown to those of such indexes may be of limited use. The adviser’s dependence on its DRS process and judgments about the attractiveness, value and potential appreciation of particular ETFs and options in which the adviser invests or writes may prove to be incorrect and may not produce the desired results. There is no guarantee any investment or the DRS will meet its objectives. All investments involve the risk of potential investment losses as well as the potential for investment gains. Prior performance is not a guarantee of future results and there can be no assurance, and investors should not assume, that future performance will be comparable to past performance. All investment strategies have the potential for profit or loss. Further information is available upon request by contacting the company directly at 970–382-8901 or www.www.swanglobalinvestments.com. 324-SGI-080618