Performance of the Defined Risk Strategy is best viewed over market cycles and various environments.
The DRS was launched in 1997 to provide a better way to invest over full-market cycles—generate consistent rolling returns, while mitigating risks to irreplaceable capital.
So how’d we do?
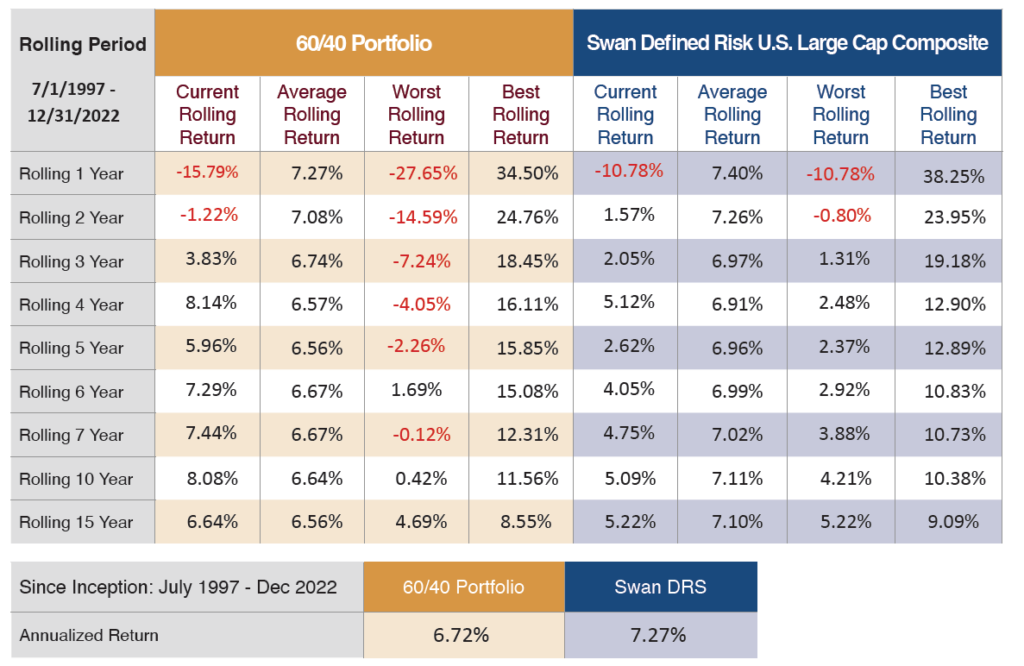
Source: Swan Global Investments and Zephyr StyleAdvisor. Data based on historic returns of a 60/40 blended composite and the Swan Defined Risk US Large Cap Composite net of fees, from 7/1997 to 12/31/2021, and assume no portfolio withdrawals. The 60/40 blended composite, weighted 60% in the S&P 500 Index, , which consists of approximately 500 large cap stocks, and 40% in the Bloomberg US Aggregate Bond Index. The 60/40 is rebalanced monthly. The Bloomberg US Aggregate Bond Index is a broad-based flagship benchmark that measures the investment grade, US dollar-denominated, fixed-rate taxable bond market. The index includes Treasuries, government-related and corporate securities, MBS (agency fixed-rate and hybrid ARM pass-throughs), ABS and CMBS (agency and non-agency). Results in the table are the best, worst, and average annualized returns, based on month-end returns, for every rolling period listed within the overall time frame of July 1st, 1997 to December 31st, 2021. Prior performance is not a guarantee of future results and there can be no assurance, and investors should not assume, that future performance will be comparable to past performance.
Average rolling returns across investing periods reveal the consistency of an investment strategy and manager execution. Consistency of returns is critical to forecasting spending and/or planning projects.
Consistent rolling returns are a hallmark of the Defined Risk Strategy, which seeks to reduce volatility and the impact of major drawdowns.
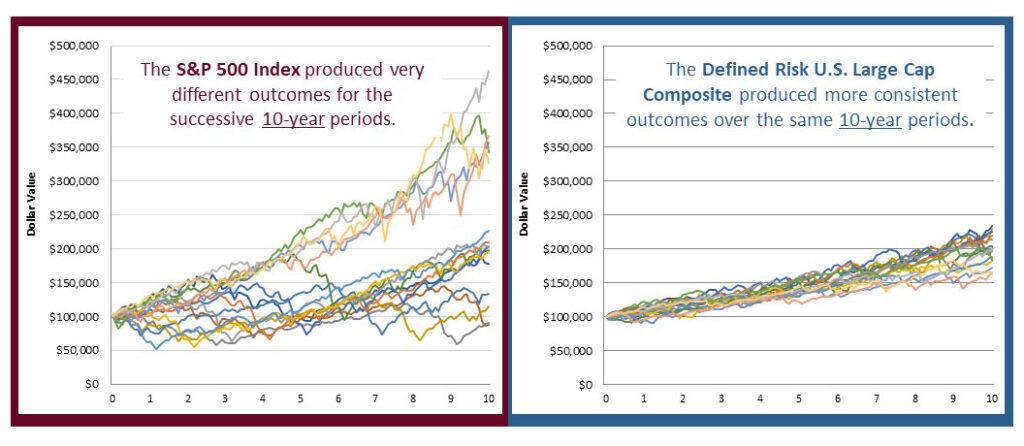
Source: Zephyr StyleADVISOR and Swan Global Investments. The chart shows fifteen 10-year period returns; the first period is from January 1, 1998 through December 31, 2007 and the last period is from January, 2013 through December, 31 2022, for the S&P 500 Index and the Swan Defined Risk US Large Cap Composite, net of fees. The S&P 500 Index is an unmanaged index, and cannot be invested into directly. NOTE – this chart is for illustration purposes, not a guarantee of future performance. The charts and graphs contained herein should not serve as the sole determining factor for making investment decisions.
Sustaining spending policies and fulfilling a mission depends on realizing positive long-term investment outcomes.
See how our Always Invested, Always Hedged approach helps institutional investors navigate and capitalize on market cycles to sustain long-term growth.
The success of our Defined Risk Strategy prompted us to apply it across multiple structures and assets, expanding the opportunity for institutional investors to apply this time-tested, risk management approach across portfolios.
Learn more about the various types of investment structures or contact a Swan investment consultant for more information.