2022 illustrated the need for a capital preservation component in investors’ portfolios. Rising interest rates created losses in fixed income that have matched losses in equities. With bonds failing to perform the capital preservation role, a hedged equity strategy would seem to fit the bill. However, not all hedged equity solutions are the same. In an extended bear market some are likely to do better than others.
When hedging with put options, one of the most important decisions is the options’ expiration cycle. Every option eventually expires, but the time to expiration varies greatly. Options can expire in days, weeks, months, or even years. The effectiveness of a put option to mitigate market losses will depend greatly upon the length of a market drawdown.
Generally speaking, short-term put options perform better in short-term sell-offs. Long-term put options, like LEAPS, tend to be better suited for long-term bear markets. This paper compares and contrasts the two.
Our portfolio managers and analysts are dedicated to creating relevant, educational Articles, Podcasts, White Papers, Videos, and more.
The pitfalls of short-term hedging solutions are illustrated by the Cboe S&P 500 5% Put Protection Index (ticker: PPUT). If one goes strictly by the name of the index, one might guess that “put protection” implies limited downside risk. One might even mistakenly interpret the “5%” to indicate some sort of buffer or maximum loss threshold. This would be an inaccurate interpretation and illustrates why it is important to understand a strategy’s construction and its possible risk and return scenarios.
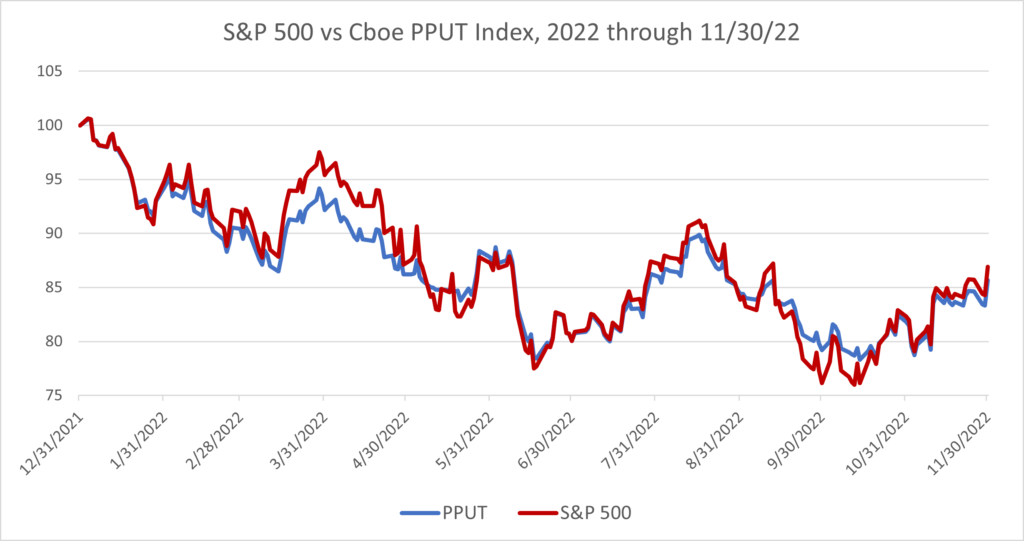
Source: Cboe, Morningstar Direct
The above graph shows the 2022 performance of the PPUT index against the S&P 500 index through November 30th. PPUT has offered little to no protection in 2022’s bear market.
Why is this?
It is important to understand how the PPUT index is constructed and the shortcomings of short-term options in an extended bear market. Cboe’s definition of PPUT is:
The Cboe S&P 500 5% Put Protection Index (PPUT) tracks the value of a hypothetical portfolio of securities (PPUT portfolio) designed to protect an investor from negative S&P 500 returns. The PPUT portfolio is composed of S&P 500® stocks and of a long position in a one-month 5% out-of-the-money put option on the S&P 500 (SPX put).
Key to this definition is “a one-month 5% out-of-the-money put option.” Hedging with one-month, 5% out-of-the-money options might appear to be a cost-effective strategy because:
Both characteristics have drawbacks, brutally exposed in the kind of bear market seen in 2022.
As stated previously, every option eventually expires. A hedging strategy that uses short-term options needs to constantly purchase new put options to replace those that have expired. During bear markets, the price of put options, especially short-term put options, tends to skyrocket as the demand for downside protection surges. In a long, grinding bear market, this can prove costly as a short-term hedging strategy is forced to repeatedly purchase new put options at elevated prices.
The “5% OTM” feature of the put options used in PPUT were designed to reduce the up-front hedging costs. However, the drawback to such an approach is that the investor is responsible for the first “tranche” of losses. For the first 5% drawdown, the investor has full market exposure. It is only if the S&P 500 losses exceed 5% – within the one-month expiration cycle– that further losses are mitigated. If the option is not “in-the-money” at the time of expiration, it is worthless. At expiration the “reset” button is hit, and a new 5% “deductible” must be taken for the coming month.
These costs add up.
The true costs of a short-term hedging strategy like PPUT are seen in a year like 2022. The bear market of 2022 has been a long, grinding one. Throughout the year the same cycle has repeated itself several times:
This market dynamic has been challenging for short-term hedging strategies like PPUT. In such an environment:
This explains why the Cboe S&P 500 5% Put Protection has been down in lock-step with the S&P 500 in 2022.
In contrast to the short-term options at or out-of-the-money, one can choose to hedge using long-term options that are at-the-money. Long-term Equity Anticipation Securities, or LEAPS, are options that have an expiration cycle of a year or longer. In a year like 2022, a LEAP put option purchased in December of 2021 would have remained valid throughout the multiple twists and turns the market has made throughout the year. The investor wouldn’t have needed to be constantly replacing expiring put options in a high-volatility environment.
Moreover, an at-the-money LEAP would be in a better position to hedge against market drawdowns in 2022. The S&P 500 peaked on the very first trading day of the year but has been underwater since then. A strategy facing multiple 5% deductibles throughout the year would have higher hedging costs in an extended bear market, limiting the effectiveness of the downside risk mitigation strategy.
Granted, there are times when short-term hedging strategies will likely perform better. The kind of approach used by PPUT will tend to do better if the market sell-off is sharp and short. If the market sell-off exceeds 5%, then the put option goes in the money. If the sell-off is short, then a strategy doesn’t need to re-hedge at elevated prices or worry about multiple deductibles.
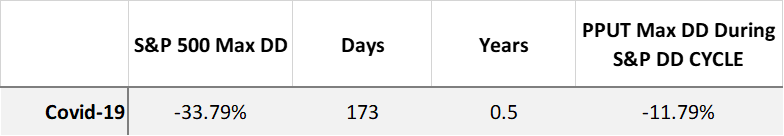
A “best case scenario” for the PPUT strategy was the massive sell-off during the Covid-19 panic in early 2020. The S&P 500 lost over a third of its value in just five weeks, then rallied sharply and ended the year up 18.4%. During this period the PPUT held up well, with a maximum drawdown of only -11.8%.
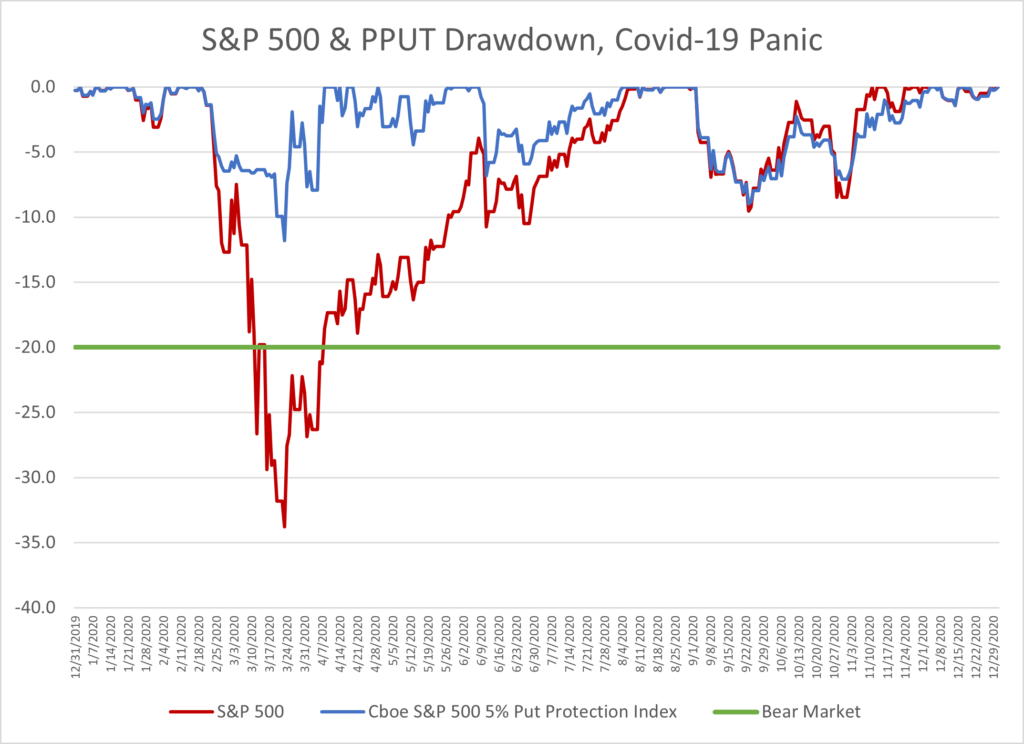
Source: Cboe, Morningstar Direct
However, in many other drawdown situations the short-term hedging strategy employed in PPUT has less-than-impressive results. If a sell-off lasts an extended period of time and has multiple legs down, the strategy will have to take on multiple “deductibles”, severely limiting the effectiveness of the short-term, 5% OTM put options. The graph below illustrates the seven largest drawdowns since 2000. Only during the Covid-19 sell-off did the short-term hedging strategy offer significant outperformance.
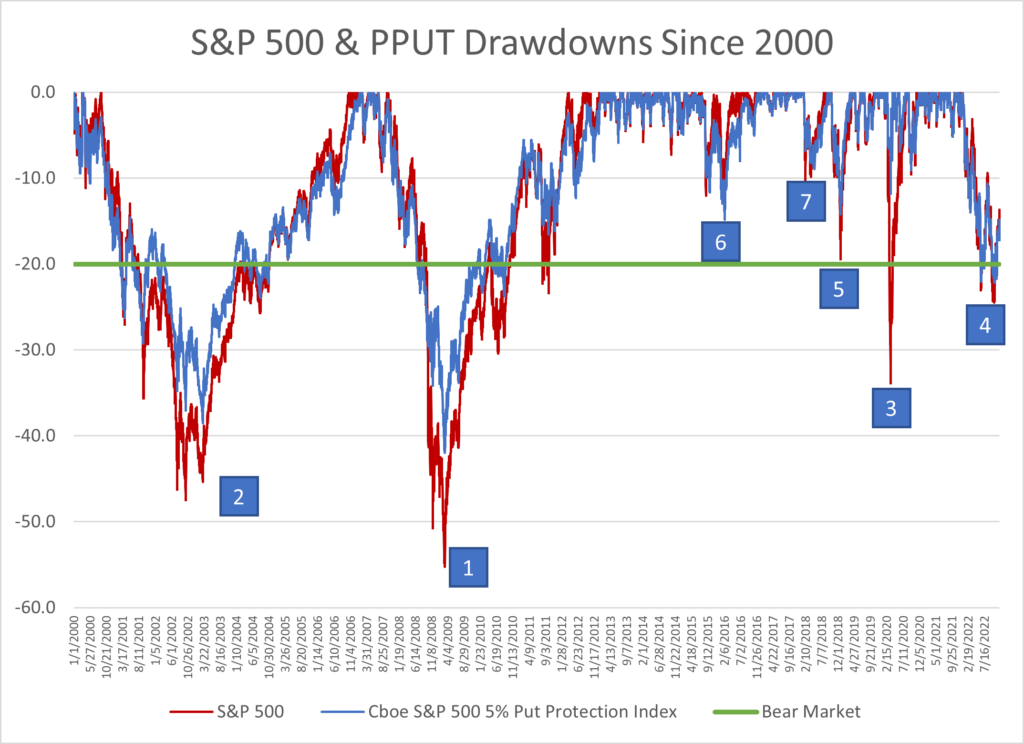
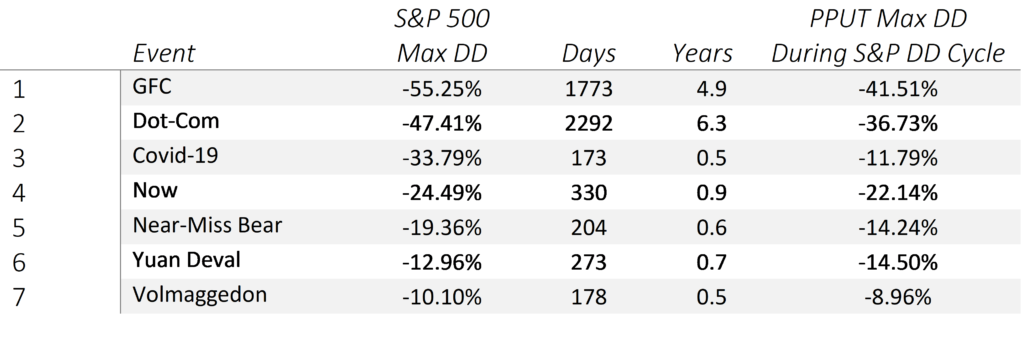
Source: Cboe, Morningstar Direct
As of this writing it is unclear whether or not the S&P 500 has found a bottom. What can be said is that it is almost one year since the market peaked on January 3rd, 2022 and this bear market has already lasted longer than the entire peak-to-trough-to-full recovery cycles of every sell-off since the Global Financial Crisis of 2007-09.
The active management of long-term LEAPS and at-the-money put options has been the cornerstone of Swan’s Defined Risk Strategy (“DRS”) for over 25 years. In addition to being designed with longer-term bear markets in mind, the DRS seeks to exploit market dislocations by actively re-hedging its portfolio. This “sell high, buy low” component to the strategy is another key distinction compared to passively managed hedging strategies.
A robust investment strategy should prepare for both bear markets and bull markets. The DRS is always invested in equity index ETFs, with no cap to upside market participation, and seeks to capitalize on market weakness via active management of long-term hedges. By seeking to combine loss mitigation with uncapped upside participation, the DRS is constructed to help investors navigate uncertainty in an attempt to provide an improved investment experience through full market cycles. This actively managed, long-term approach to hedged equity may deliver the most benefit to investors during large market swings, like we’re seeing in the current environment.
As we roll into 2023, the forecasts for recession and more market pain are mounting. The bear market has already lasted longer than any other drawdown since the Global Financial Crisis. Moreover, traditional allocation strategies may continue to struggle. The market cycle is still unfolding, and there is still time to prepare.
Marc Odo, CFA®, FRM®, CAIA®, CIPM®, CFP®, Client Portfolio Manager, is responsible for helping clients and prospects gain a detailed understanding of Swan’s Defined Risk Strategy, including how it fits into an overall investment strategy. His responsibilities also include producing most of Swan’s thought leadership content. Formerly Marc was the Director of Research for 11 years at Zephyr Associates.
Our portfolio managers and analysts are dedicated to creating relevant, educational Articles, Podcasts, White Papers, Videos, and more.
Swan Global Investments, LLC is a SEC registered Investment Advisor that specializes in managing money using the proprietary Defined Risk Strategy (“DRS”). SEC registration does not denote any special training or qualification conferred by the SEC. Swan offers and manages the DRS for investors including individuals, institutions and other investment advisor firms.
All Swan products utilize the Defined Risk Strategy (“DRS”), but may vary by asset class, regulatory offering type, etc. Accordingly, all Swan DRS product offerings will have different performance results due to offering differences and comparing results among the Swan products and composites may be of limited use. All data used herein; including the statistical information, verification and performance reports are available upon request. The S&P 500 Index is a market cap weighted index of 500 widely held stocks often used as a proxy for the overall U.S. equity market. The Bloomberg US Aggregate Bond Index is a broad-based flagship benchmark that measures the investment grade, US dollar-denominated, fixed-rate taxable bond market. The index includes Treasuries, government-related and corporate securities, MBS (agency fixed-rate and hybrid ARM pass-throughs), ABS and CMBS (agency and non-agency). Indexes are unmanaged and have no fees or expenses. An investment cannot be made directly in an index. Swan’s investments may consist of securities which vary significantly from those in the benchmark indexes listed above and performance calculation methods may not be entirely comparable. Accordingly, comparing results shown to those of such indexes may be of limited use. The adviser’s dependence on its DRS process and judgments about the attractiveness, value and potential appreciation of particular ETFs and options in which the adviser invests or writes may prove to be incorrect and may not produce the desired results. There is no guarantee any investment or the DRS will meet its objectives. All investments involve the risk of potential investment losses as well as the potential for investment gains. Prior performance is not a guarantee of future results and there can be no assurance, and investors should not assume, that future performance will be comparable to past performance. Further information is available upon request by contacting the company directly at 970-382-8901 or www.swanglobalinvestments.com. 330-SGI-121522