This site uses cookies. By continuing to browse the site, you are agreeing to our use of cookies. Privacy Policy
Okay, thanksJun. 28, 2021
If So, Then Fix It!
(Original Post August 2018, Updated June 2021)
For decades, the standard representation for a balanced portfolio has been the “60/40”- 60% equities, 40% bonds. Although most investors diversified beyond this model and incorporated small caps, foreign stocks, high yield bonds, and perhaps something more exotic like REITs or commodities, a simple mix of 60% S&P 500 and 40% Barclays U.S. Aggregate Bond is often the shorthand definition of a balanced portfolio.
For a generation, this simple approach worked well. Stocks provided capital appreciation and dividends, albeit with a dose of volatility. Bonds produced yield, capital appreciation as rates fell, and acted as a volatility dampener when stocks went south. One could have met actuarial demands of 7%, 8%, or even 9% via this simple portfolio.
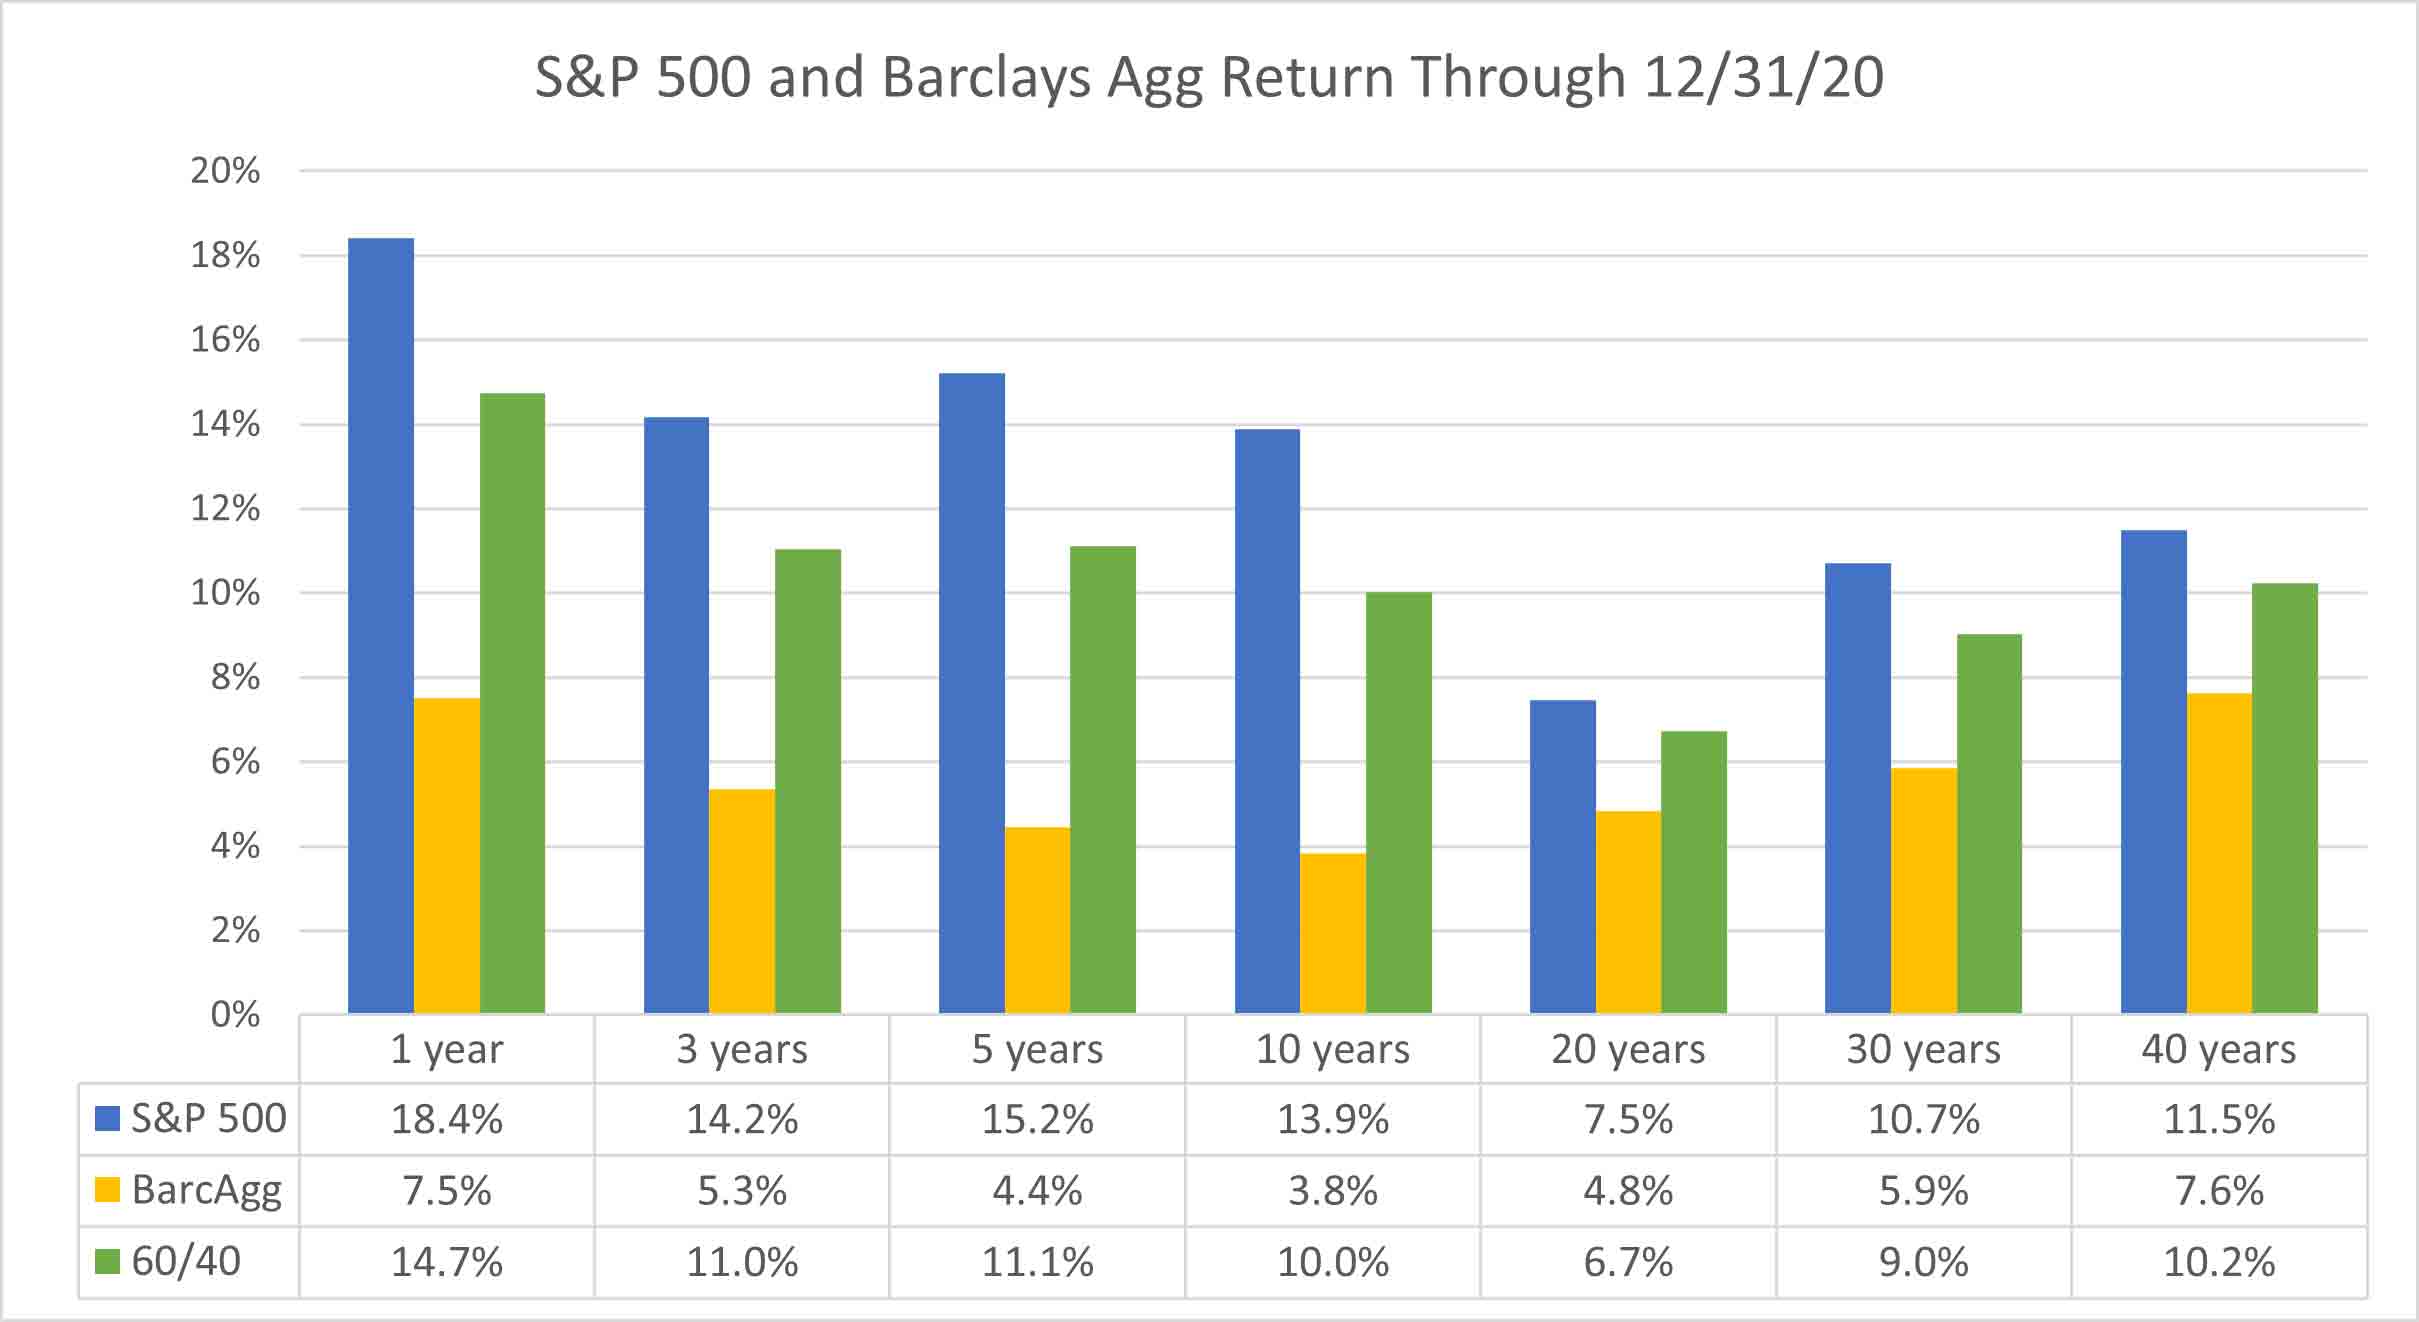
Source: Zephyr StyleADVISOR
Looking at the above numbers, one might be tempted to say, “If it ain’t broke, then don’t fix it.” However, such an approach is dangerously naïve.
The simple truth is that the likelihood of bonds posting returns anywhere near their historic levels is close to zero.
Our portfolio managers and analysts are dedicated to creating relevant, educational Articles, Podcasts, White Papers, Videos, and more.
In the graph below we can see how the current yield has been a very strong indicator of what future returns in the bond market might be. The graph compares the yield on the 10-year Treasury against the subsequent 10-year return on the Barclay’s Aggregate Index.

Source: U.S. Treasury Department, Zephyr StyleADVISOR
With yields currently in the sub-2% range, the forecast for future bond returns in not good.
What impact does this have on the standard 60/40 mix?
Let’s run a simple algebraic calculation. Assume we have a standard 60/40 mix and the target return for the overall portfolio is 8%. If we assume that the 40% position in fixed income will return 2%, what would the remaining 60% in equities have to return in order to lift the portfolio up to 8%?

The answer may come as a nasty surprise: 12%.
If bonds can only deliver a 2% return, then equities must return 12% in order to produce an overall portfolio return of 8%. The table below details the levels of returns the 60% position in equity must generate in order to achieve different levels of total portfolio returns, assuming the fixed income return is locked in at 2%.

Given these circumstances, investors are left with an unappealing set of options, which include:
Hoping that capital markets will do better than expected is a dangerous choice.
A forecasted return of 2% on bonds might actually be too generous. After all, ten- year yields are only 1.58% as of May 31st, 2021. Moreover, should rates rise bonds could suffer losses.
The average duration of several Morningstar fixed income categories is listed below. Should rates rise the average fund in these categories would be expected to lose the following amounts.
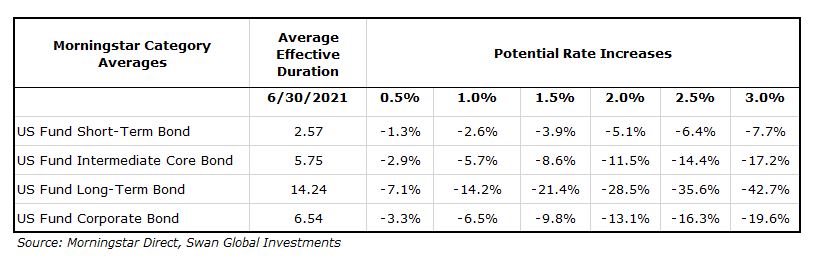
NOTE: This illustration simply applies potential rate increases to average effective duration and does not take into account other factors like convexity, non-parallel shifts in the yield curve, widening of credit spreads, etc.
Although bonds are typically assumed to play the “capital preservation” role in a portfolio if rates rise it is highly likely bonds will instead deliver losses.
At Swan Global Investments, we believe there is another option. We believe the traditional 60% equity/40% fixed income portfolio is fundamentally broken and needs help.
Investors are caught between a rock and a hard place, as both equity markets and fixed income markets are trading at all-time highs. We believe that the Defined Risk Strategy is a better solution and helps fix the problems with traditional balanced portfolios.
Launched in 1997, the Defined Risk Strategy is a hedged equity approach that combines long exposure to the equity market via ETFs, effective hedging techniques, and volatility capture in a single strategy designed to provide consistent rolling returns throughout rising, declining, or flat markets without any dependency on fixed income or interest rates.
Click to learn more about Swan’s DRS investment approach and how this approach has fared in the past.
For more information please contact Swan at 970-382-8901.
Marc Odo, CFA®, CAIA®, CIPM®, CFP®, Client Portfolio Manager, is responsible for helping clients and prospects gain a detailed understanding of Swan’s Defined Risk Strategy, including how it fits into an overall investment strategy. Formerly, Marc was the Director of Research for 11 years at Zephyr Associates.
Our portfolio managers and analysts are dedicated to creating relevant, educational Articles, Podcasts, White Papers, Videos, and more.
Swan Global Investments, LLC is a SEC registered Investment Advisor that specializes in managing money using the proprietary Defined Risk Strategy (“DRS”). SEC registration does not denote any special training or qualification conferred by the SEC. Swan offers and manages the DRS for investors including individuals, institutions and other investment advisor firms. All data used herein; including the statistical information, verification and performance reports are available upon request. The S&P 500 Index is a market cap weighted index of 500 widely held stocks often used as a proxy for the overall U.S. equity market. The Barclays US Aggregate Bond Index is a broad-based flagship benchmark that measures the investment grade, US dollar-denominated, fixed-rate taxable bond market. The index includes Treasuries, government-related and corporate securities, MBS (agency fixed-rate and hybrid ARM pass-throughs), ABS and CMBS (agency and non-agency). Indexes are unmanaged and have no fees or expenses. An investment cannot be made directly in an index. Swan’s investments may consist of securities which vary significantly from those in the benchmark indexes listed above and performance calculation methods may not be entirely comparable. Accordingly, comparing results shown to those of such indexes may be of limited use.
The adviser’s dependence on its DRS process and judgments about the attractiveness, value and potential appreciation of particular ETFs and options in which the adviser invests or writes may prove to be incorrect and may not produce the desired results. There is no guarantee any investment or the DRS will meet its objectives. All investments involve the risk of potential investment losses as well as the potential for investment gains. This analysis is not a guarantee or indication of future performance. Prior performance is not a guarantee of future results and there can be no assurance, and investors should not assume, that future performance will be comparable to past performance. All investment strategies have the potential for profit or loss. Further information is available upon request by contacting the company directly at 970.382.8901 or visit swanglobalinvestments.com.
141-SGI-061521