Allow me to provide some context.
In the spring, “Wannabe” by The Spice Girls was the #1 song in America, later followed by “MMMBop” by Hanson. “Men in Black” would dominate the summer box office, but MiB would be dwarfed by “Titanic” later on in the year. Tim Duncan had just been drafted by the San Antonio Spurs and the Houston Oilers departed to Tennessee. People were starting to worry about the dreaded “Y2K” bug.
While many use cultural milestones like music, movies, or sports to mark a time and a place, let’s look at where the capital markets were.
In July 1997, the Dow Jones Industrial Average crossed 8,000 and the S&P 500 cracked 900[1], both firsts. Apple Computers was a joke, Amazon.com was an online bookstore, and Google, Facebook, and YouTube did not yet exist. Alan Greenspan had warned about “irrational exuberance” creeping into the market in December 1996, but the Dot-com Bubble was still a year or two in the future. On July 1st, 1997 3-month yields were 5.31% and 30-year Treasury bonds yielded 6.74%[2].
July 1997 was also when Randy Swan launched the Defined Risk Strategy (DRS). Randy’s vision was, and remains, to offer investors a unique approach to investing and an alternative to the traditional 60/40 portfolio. With the love and support of his wife Laura, Randy moved to Durango, Colorado to establish what was then called Swan Consulting.
The goal was to “build a better mousetrap”—to design an investment strategy that addressed the shortcomings of traditional asset allocation. Traditional asset allocation seeks to mitigate risk through diversification, but one of the main caveats of asset allocation is that market risk cannot be diversified away.
To Randy, leaving the biggest source of risk unaddressed was unacceptable; therefore, if market risk cannot be diversified away, the DRS sought to hedge it away.
While the previously mentioned Y2K bug turned out to be a non-issue, the last 22 years have seen a multitude of market environments:
Just about every market environment imaginable has happened over the last 20 years: the two largest bear markets since World War II as well as the second-longest bull market is U.S. history; losses of 50% as well as gains of 300%; short-term shocks and corrections; two wars and an attack on American soil; a reversal in the multilateral, collaborative, post-World War II order; technological innovations unimaginable in 1997; and commodities at historic highs as well as lows.
While the markets have undergone significant changes, the Defined Risk Strategy has not. The overall goal remains the same: maximize the return-risk trade-off by minimizing the impact of down markets. We remain “always invested, always hedged” by actively hedging our holdings in the market.
How has Swan delivered on this goal?
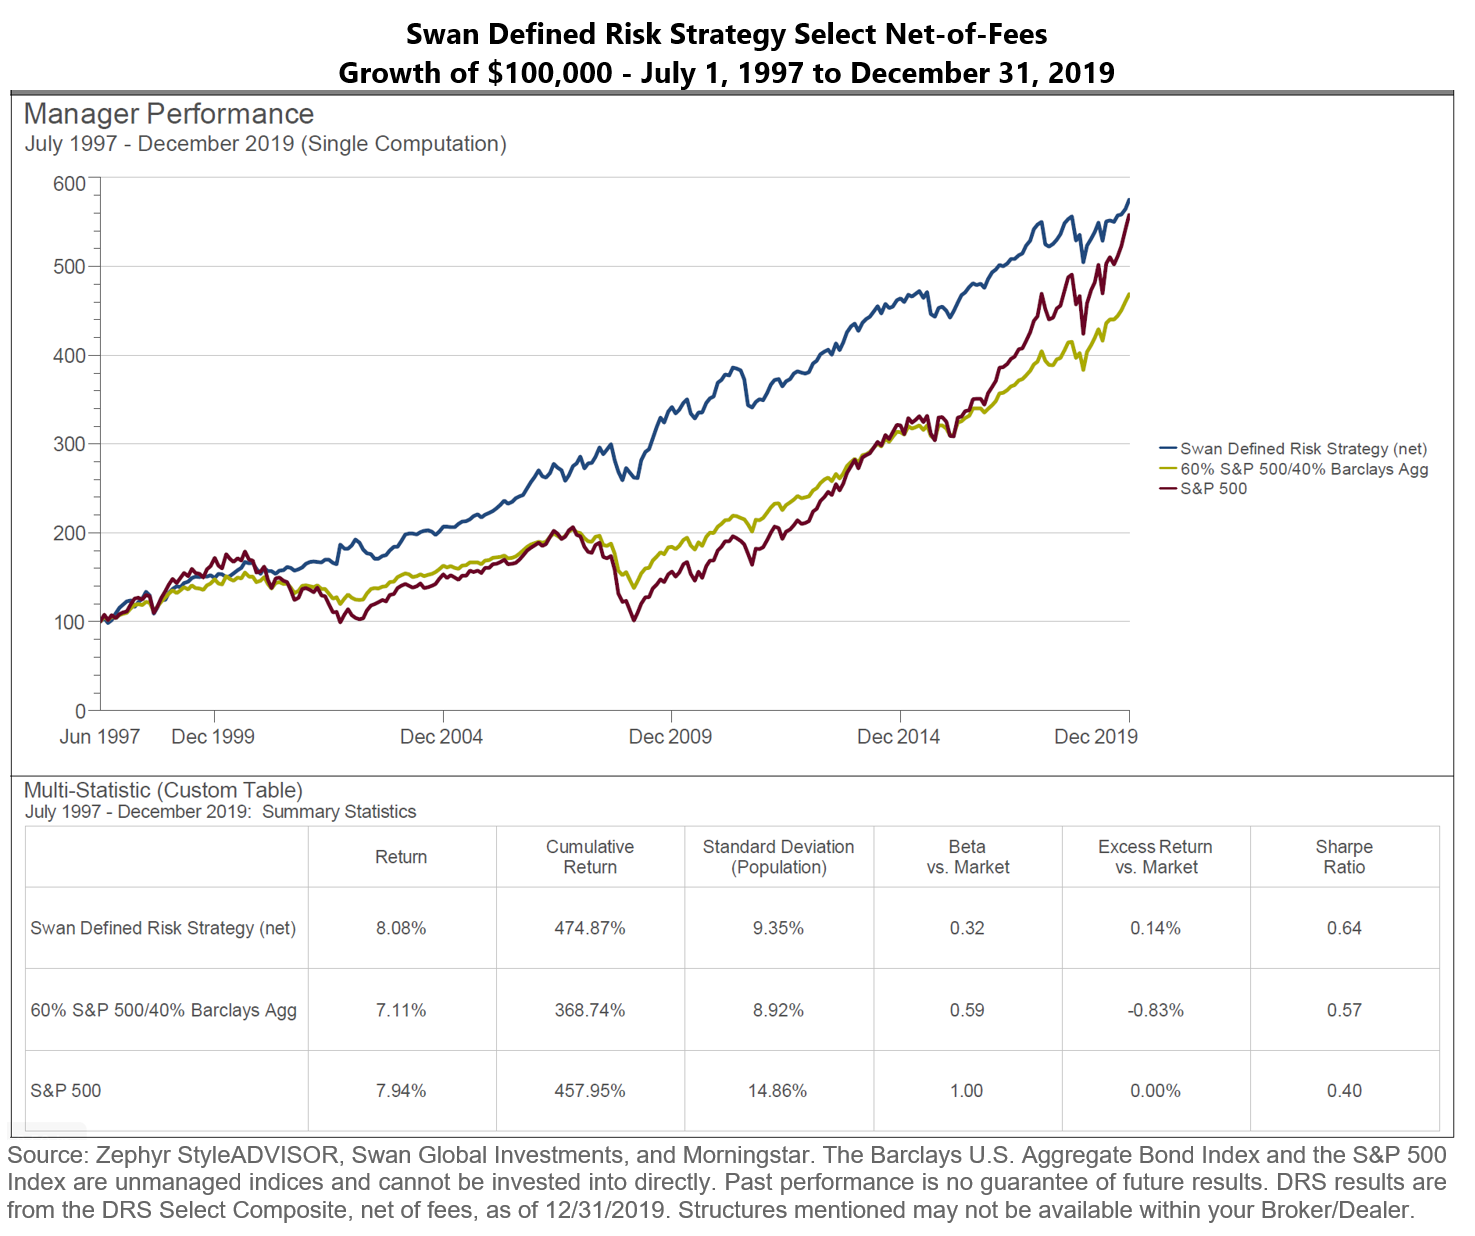
The Swan Defined Risk Select Composite has historically outperformed both the S&P 500 and a blended 60/40 stock/bond mix, on both an absolute and risk-adjusted basis. It’s important to keep in mind what that blue line incorporates. It’s not just 22 years….it’s all those crises listed above. The DRS has been battle-tested through all the aforementioned events.
Of course, someone might legitimately claim that very few people would have been invested in the DRS for that full 22-year period. The previous graph represents the entire history of the DRS.
So what if someone had only been invested for a sub-period…say, for example, a period of 10 years rather than 22?
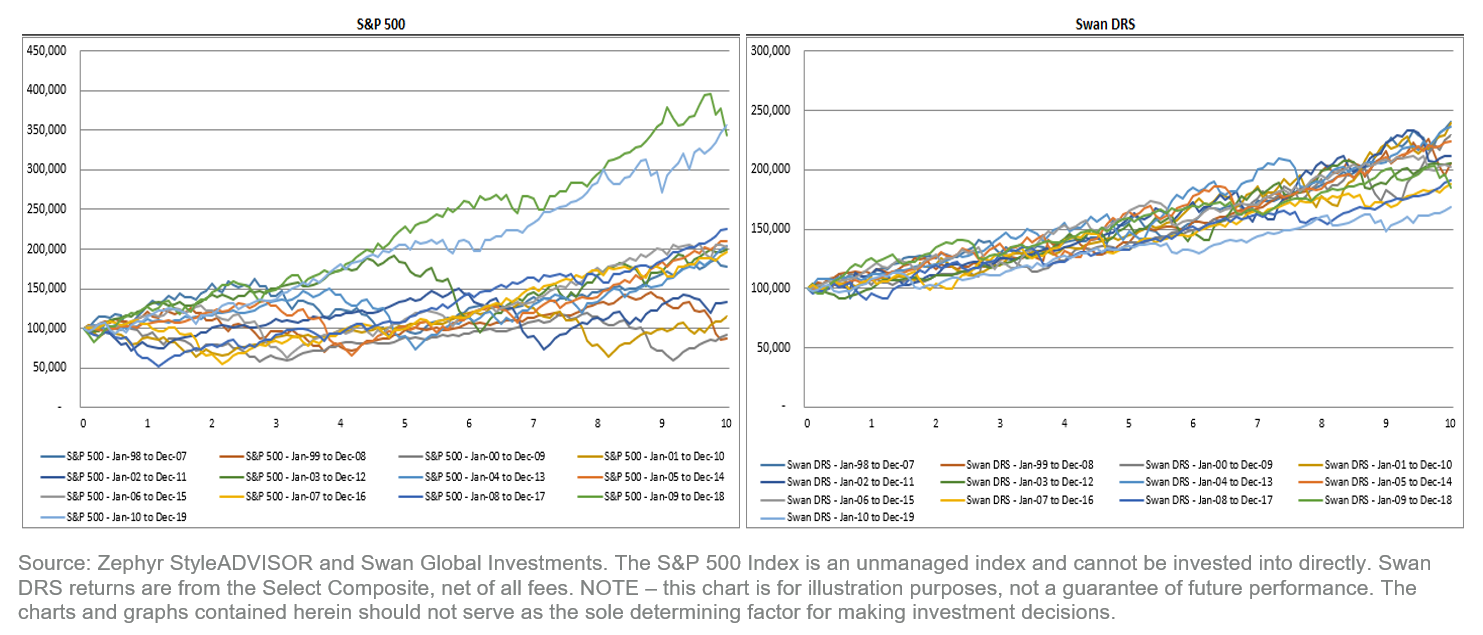
The above comparison is one of Swan’s most popular graphs showing thirteen, 10-year investment periods. The first period is 1/1998 to 12/2007; the last period is 1/2010 to 12/2019. Each line represents a ten-year investment period with a different inception date (when the initial investment was made).
In other words, the lines chart the “ride” investors experienced over 10 years in the S&P 500 (left) or the DRS (right), if they were to simply change the date of their initial investment.
The contrast in outcomes is stark. While the unhedged S&P 500 has had outcomes all across the board, the DRS has been able to maintain a much tighter range of outcomes by mitigating the impact of those two big bear markets.
We have run similar analysis over 3, 5, and 15 year rolling periods, which are available to investment professionals and advisors upon request. Investors should contact their financial advisor to learn about the significance of rolling period returns.
Throughout the last twenty years the DRS has remained very consistent, both in terms of investment results as well as the underlying investment process. What has changed is Swan Global Investments as an organization. What started as a one-person shop with a few million under management has grown to over forty team members and $3.1bn AUM.
The DRS is available across multiple asset classes and in different investment structures: a separately managed account, in mutual funds, CITs or customized solutions.
Furthermore, Swan is consistently publishing research and is recognized as a leader in options and hedged equity.
Looking into the future, it is reasonable to expect bull markets and bear markets, unforeseen events, and a lot of volatility along the way.
Whatever the future brings, the DRS was designed as a full market cycle solution with meaningful upmarket participation and significant down-market risk mitigation.
We look forward to the challenge.
David Lovell, Director of Marketing, is responsible for Swan’s marketing and engagement initiatives. This includes development and execution of marketing programs for Swan’s websites, content, communications, events, and media. David began his career in the financial industry at Mass Mutual. David currently holds a Series 65 license.
[1] Source: finance.yahoo.com
[2] Source: http://www.treasury.gov/resource-center/data-chart-center/interest-rates/Pages/TextView.aspx?data=yield
Swan Global Investments, LLC is a SEC registered Investment Advisor that specializes in managing money using the proprietary Defined Risk Strategy (“DRS”). SEC registration does not denote any special training or qualification conferred by the SEC. Swan offers and manages the DRS for investors including individuals, institutions and other investment advisor firms. All Swan products utilize the Swan DRS but may vary by asset class, regulatory offering type, etc. Accordingly, all Swan DRS product offerings will have different performance results, and comparing results among Swan products and composites may be of limited use. Any historical numbers, awards and recognitions presented are based on the performance of a (GIPS®) composite, Swan’s DRS Select Composite, which includes non-qualified discretionary accounts invested in since inception, July 1997, and are net of fees and expenses. Swan claims compliance with the Global Investment Performance Standards (GIPS®). All data used herein; including the statistical information, verification and performance reports are available upon request. The S&P 500 Index is a market cap-weighted index of 500 widely held stocks often used as a proxy for the overall U.S. equity market. Indexes are unmanaged and have no fees or expenses. An investment cannot be made directly in an index. Swan’s investments may consist of securities which vary significantly from those in the benchmark indexes listed above and performance calculation methods may not be entirely comparable. Accordingly, comparing results shown to those of such indexes may be of limited use. The adviser’s dependence on its DRS process and judgments about the attractiveness, value and potential appreciation of particular ETFs and options in which the adviser invests or writes may prove to be incorrect and may not produce the desired results. There is no guarantee any investment or the DRS will meet its objectives. All investments involve the risk of potential investment losses as well as the potential for investment gains. Prior performance is not a guarantee of future results and there can be no assurance, and investors should not assume, that future performance will be comparable to past performance. All investment strategies have the potential for profit or loss. Further information is available upon request by contacting the company directly at 970–382-8901 or www.www.swanglobalinvestments.com.
118-SGI-032320