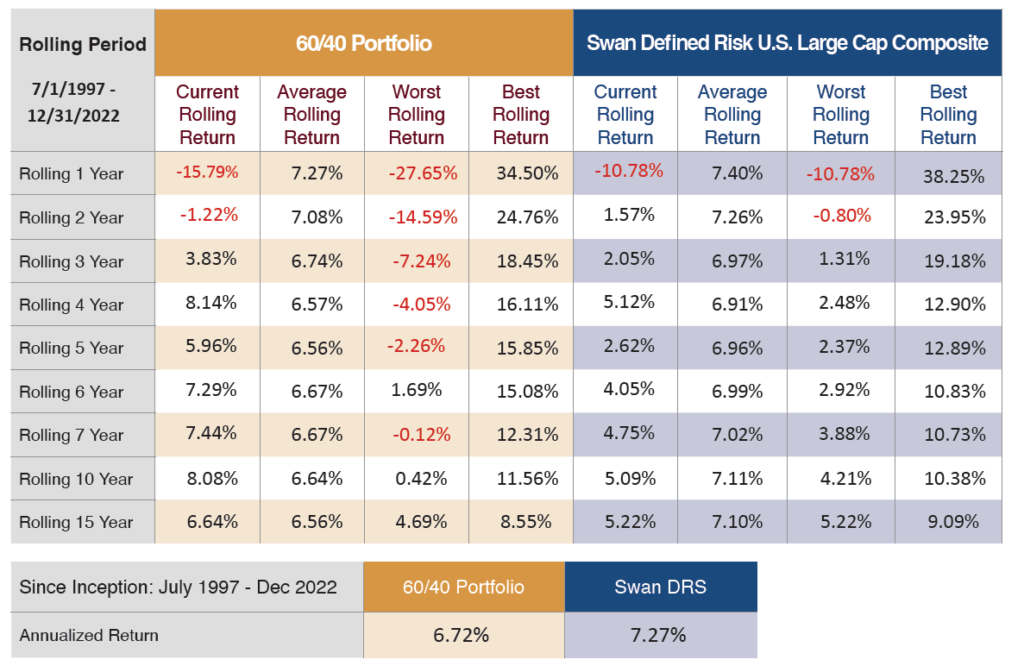
Source: Swan Global Investments and Zephyr StyleAdvisor. Data based on historic returns of a 60/40 blended composite and the Swan Defined Risk US Large Cap Composite net of fees, from 7/1997 to 12/31/2023, and assume no portfolio withdrawals. The 60/40 blended composite, weighted 60% in the S&P 500 Index, which consists of approximately 500 large cap stocks, and 40% in the Barclays US Aggregate Bond Index. The 60/40 is rebalanced monthly. The Barclays US Aggregate Bond Index is a broad-based flagship benchmark that measures the investment grade, US dollar-denominated, fixed-rate taxable bond market. The index includes Treasuries, government-related and corporate securities, MBS (agency fixed-rate and hybrid ARM pass-throughs), ABS and CMBS (agency and non-agency). Results in the table are the best, worst, and average annualized returns, based on month-end returns, for every rolling period listed within the overall time frame of July 1st, 1997 to December 31st, 2023. Prior performance is not a guarantee of future results and there can be no assurance, and investors should not assume, that future performance will be comparable to past performance.
Rolling returns offer a more comprehensive view of returns as they consider returns over various time periods and different start dates.
Consistent rolling returns are a hallmark of the Defined Risk Strategy.
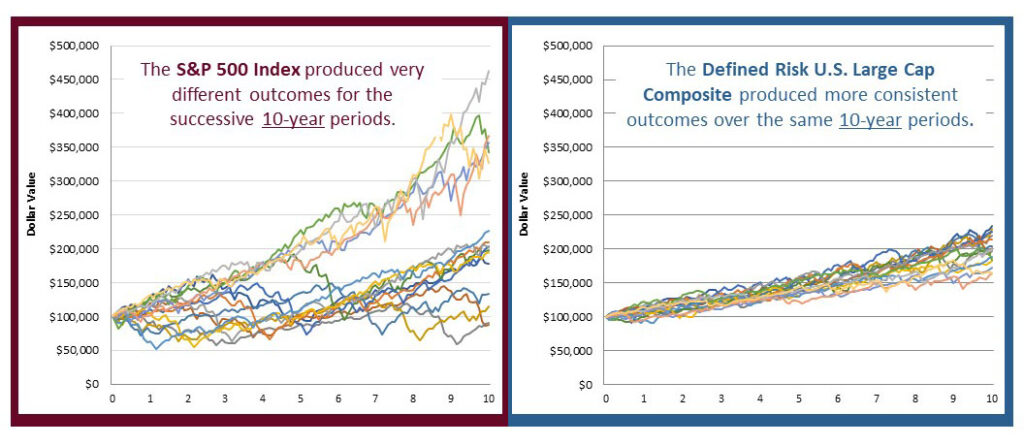
Source: Zephyr StyleADVISOR and Swan Global Investments. The chart shows fourteen 10-year period returns; the first period is from January 1, 1998 through December 31, 2007 and the last period is from January, 2014 through December, 31 2023, for the S&P 500 Index and the Swan Defined Risk US Large Cap Composite, net of fees. The S&P 500 Index is an unmanaged index, and cannot be invested into directly. NOTE – this chart is for illustration purposes, not a guarantee of future performance. The charts and graphs contained herein should not serve as the sole determining factor for making investment decisions.
It’s all about investor outcomes. Long-term investors will need to navigate many market cycles to stay on track.
See how Always Invested, Always Hedged approach helps investors dampen bear market losses and capitalize on market cycles to springboard compounding growth.