Haven’t we seen this before?
A well-circulated chart made its way around the investment world throughout 2015. It was a chart comparing the S&P 500 in 2011 to 2015. With the exception of a little less volatility in 2015, the years are eerily similar when compared to each other, even on a monthly return basis.
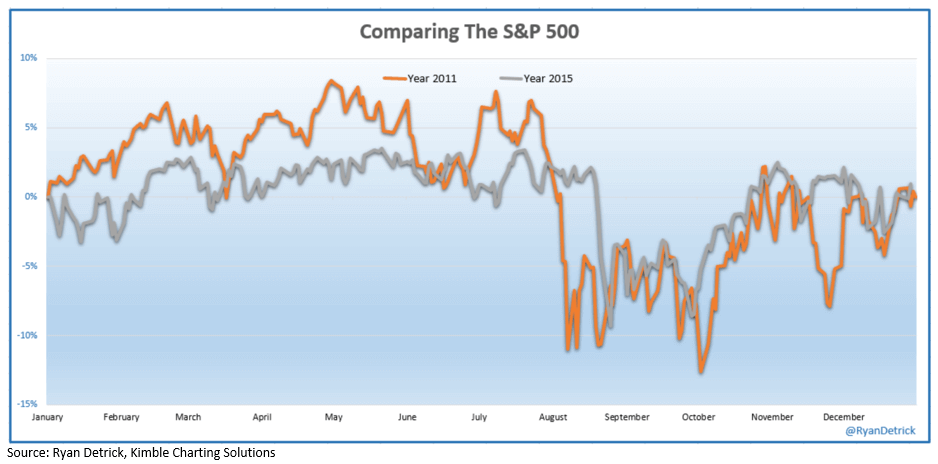
In both of these years, the market traded sideways from January to December, despite some historic volatility and market swings in between. After a sideways market in 2015, the focus shifts to what lies ahead and if the market will offer more of the same.
One popular explanation is behavioral finance. Behavioral finance is the concept that investor psychology causes market prices and fundamental values to diverge over periods of time. Psychological biases cause investors to underreact or overreact to new information, as fear, greed, and emotion tend to drive investment decisions. But on a more fundamental basis, economies, businesses, and populations growing or shrinking over time is what truly drives the markets. As Benjamin Graham famously said, “In the short run, the market is a voting machine but in the long run, it is a weighing machine.”
Therefore, a flat market is usually the result of some uncertainty in the markets.
Uncertainty about economic growth, government policy, the geopolitical landscape, and more, will influence investor’s behavior and how they react to information as it becomes available. In 2015, the good news and bad news were pretty equally weighted, and consequently, markets ended up flat. However, after a period of flatness, the scales usually tip one way or the other and overreacting market participants drive the market up or down.
Now it’s time for a little introspection…
For the Swan Defined Risk Strategy (“DRS”), flat markets make for a less than optimal environment. Similar DRS performance in 2015 and 2011 was not unexpected. In a flat market, the underlying investment in market ETFs usually doesn’t make any gains of substance. In fact, in the case of 2015, our equal-weight sector approach trailed the cap-weighted market by around 250 bps. Moreover, there is a cost over the year associated with the investments always being hedged. In a flat market, this hedging cost is generally in the 2–3% range.
It is important to note, however, that the DRS can still be positive in a flat market if the returns from the income component of the strategy are close to its historical annual average return. In 2015, although positive on the year, the income component’s return was below its historical average.
In summary, a flat year in 2016 is highly unlikely. Could it still happen? Yes, it could, just as a big up or down move could happen. But history would say to be on the lookout for a big move.
More importantly, 69% of the time since 1926 the S&P 500 has been up or down more than 10%.
These types of returns are usually better environments for the DRS to either protect on the downside or capture some of the upside of the markets. Either way, the DRS is constructed in such a way as to maximize the probability of successful returns over a long-term cycle by focusing on the 69%; protection and growth participation.
We believe that even if the markets act abnormally and stay flat for years to come that the DRS will be better positioned than other equity approaches for whatever the market may bring.
Here’s to a happy and prosperous 2016!
Also feel free to contact your Swan representative at 970–382-8901, or visit our Contact page if you have further questions.
Statistician Ryan Detrick recently did some analysis of flat markets, defined as less than +3% and better than -3%, and found these interesting statistics:
The last time the S&P 500 was flat two straight years was 1947 and 1948 at 0.00% and -0.65%.
Using historical data back to 1872, only 15% of all years end up flat.
66% of all years move at least 10% (up or down). 28% of all years move at least 20% and 11% move at least 30%.
If you expand the definition of a flat market a little further out to +4/-4% and begin the analysis when S&P 500 data becomes more robust in 1926, flat markets only occur 10% of the time, with nine occurrences across 90 years. Of those nine, two happened in the 1930s, two happened in the 1990s, and two happened this decade. They have never occurred back to back and three flat years have never occurred within the same decade. But this is just the S&P 500; what about other equity markets?
The MSCI EAFE Index, representing Foreign Developed equity markets, began in 1970 and over the past 46 years, its annual returns were flat 11% of the time. When looking at Emerging Markets, using the MSCI EM Index, which began in 1989, 11% of the time its annual returns were flat.
Market history should never be a means of predicting future performance. What has happened in the past does not mean the future will mirror it. But there are lessons to be learned by studying market history and its mechanics if it can give us potential insights on the likely distribution of returns. From the data outlined above, it is reasonable to conclude that we should expect the equity markets to be flat around 10% of the time. So, we know that markets will trade sideways on occasion, but why and what happens after?
Micah Wakefield, CAIA®, Director of Research and Product Development, is a part of the investment management team at Swan and focuses on research and analysis, strategic planning, and product development. Prior to joining Swan, Micah was the Director of Operations and Trading at an investment advisory firm.
Swan Global Investments, LLC is a SEC registered Investment Advisor that specializes in managing money using the proprietary Defined Risk Strategy (“DRS”). SEC registration does not denote any special training or qualification conferred by the SEC. Swan offers and manages the DRS for investors including individuals, institutions and other investment advisor firms. Any historical numbers, awards and recognitions presented are based on the performance of a (GIPS®) composite, Swan’s DRS Select Composite, which includes non-qualified discretionary accounts invested in since inception, July 1997, and are net of fees and expenses. Swan claims compliance with the Global Investment Performance Standards (GIPS®). All data used herein; including the statistical information, verification and performance reports are available upon request. The S&P 500 Index is a market cap weighted index of 500 widely held stocks often used as a proxy for the overall U.S. equity market. Indexes are unmanaged and have no fees or expenses. An investment cannot be made directly in an index. Swan’s investments may consist of securities which vary significantly from those in the benchmark indexes listed above and performance calculation methods may not be entirely comparable. Accordingly, comparing results shown to those of such indexes may be of limited use. The adviser’s dependence on its DRS process and judgments about the attractiveness, value and potential appreciation of particular ETFs and options in which the adviser invests or writes may prove to be incorrect and may not produce the desired results. There is no guarantee any investment or the DRS will meet its objectives. All investments involve the risk of potential investment losses as well as the potential for investment gains. Prior performance is not a guarantee of future results and there can be no assurance, and investors should not assume, that future performance will be comparable to past performance. All investment strategies have the potential for profit or loss. Further information is available upon request by contacting the company directly at 970–382-8901 or www.www.swanglobalinvestments.com. 001-SGI-010616