Recent global equity market sell-offs, like those seen in the first quarters of both 2016 and 2018, justifiably generate media attention and investor concern. But they also present an opportunity to evaluate risk.
While market drawdowns are inevitable and necessary for healthy markets, investors don’t exactly jump for joy when one occurs. It’s important, however, for investors to remember the differences between the two types of market downturns; corrections and bear markets. In an industry too often focused on short-term returns, corrections can cause short-sighted reactions that negatively impact long-term plans.
This post defines and compares the nature of corrections and bear markets, analyzes their impacts on investors, and considers which type of downturn is more important to seek protection against.
Prolonged bull markets with periods of low volatility can create risk complacency and even risk amnesia. Any subsequent market correction and/or spike in volatility often shakes investors out of their state of complacency and ignites fear of what they may have temporarily forgotten—markets can and will go down.
Because loss aversion is such a strong emotional driver, it is typical for many investors to transition quickly into a state of panic. Media coverage of market turmoil or daily losses for major indices can compound investor anxiety and drive nervous calls to advisors.
Investing opens investors up to the possibility of losses—but mathematically speaking, not all losses are equal. Understanding the different kinds of losses between a correction and bear market may help investors better handle or prepare for them.
In the past 20 years, the S&P 500 Index has experienced five corrections (not including the corrections occurring as part of bear markets) and two bear markets.
Corrections are often defined as losses in market value exceeding 10% but less than 20% and happen from a market high. Corrections have historically lasted from between a few weeks to a few months from start of the downturn to full recovery.

Source: Yahoo Finance, S&P 500 Total Return Index. *The recovery of this correction is still ongoing at the time of this posting.
Bear markets are defined as losses in market value of 20% or more and have historically lasted several months to several years. The losses experienced in bear markets are more intense and require longer recovery periods on average than corrections, as shown below.

Source: Yahoo Finance, S&P 500 Total Return Index
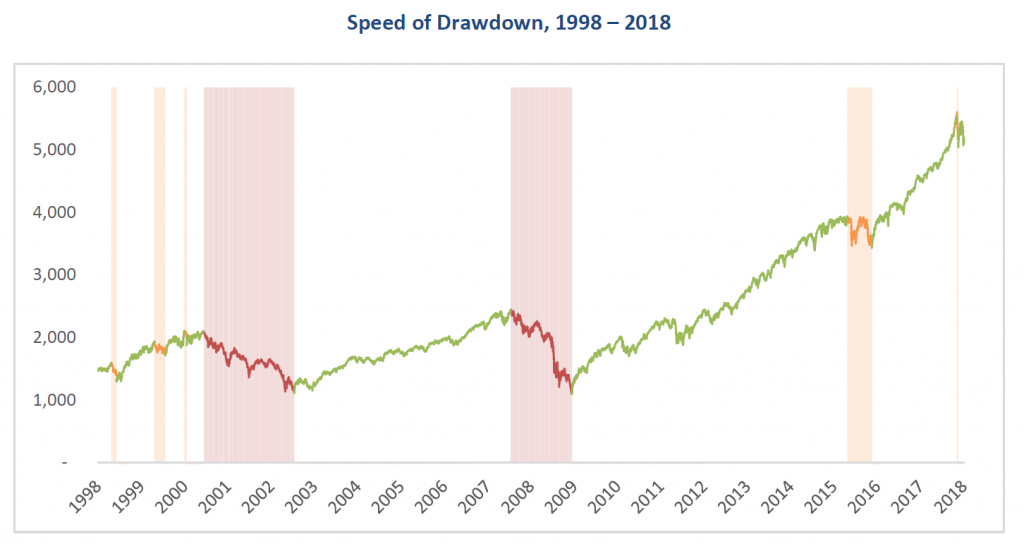
The speed of the drawdown refers to how fast, measured in days, the markets fall from peak to trough. Over the past twenty years, the speed of the fall for corrections can be measured in a matter of days to a few months, while the bear markets took much longer, generally extending over a year.
While faster drawdowns impact emotions and media response, what is more important to investor outcomes is the magnitude or intensity of the drawdown and the length of the recovery.
Source: Yahoo Finance, S&P 500 Total Return Index
The intensity of the drawdown measures how much market value was lost. As defined earlier, corrections are market losses of between -10% and -19%. Over the last twenty years, the most intense correction delivered a 19% drawdown and the least intense corrections created a market value loss of about 12-13%.
By comparison, the magnitude or intensity of losses during bear markets are often more difficult for investors to stomach. Although a bear market is defined as losses in value of more than 20%, the two in the past 20 years were more than -47%, more than double the losses caused by corrections. The intensity and effects of a bear market are unmatched, especially when we consider time of recovery.
Recovery time refers to how long it takes for the market to recoup its losses and return to pre-fall levels. Mathematically speaking, the larger the loss, the larger the gain needed to recover. So if market corrections cause smaller losses by definition, one could reason they would require less recovery time.
It is important to note here, that recovery time depends on the intensity of the drawdown and the nature of the market after the drawdown ends and recovery begins, so recovery times are not always in direct correlation to the drawdown intensity.
The -13% drawdown of the 2015-2016 correction took about two months to recover while the -19% correction in 1998 took only about three months. The -11% drop in 2000, though, took almost five months to recover.
Despite the discrepancy between corrections’ drawdowns and recovery times over the last 20 years, they all took less than half a year to recover. The recovery for the bear markets, however, required years of recovery time.
The duration of a drawdown includes both the total length of time the market took to fall from a peak to the trough and the length of time to recover the losses back to the pre-drawdown level.
The graph below shows the depth and duration of losses of the corrections and bear markets.
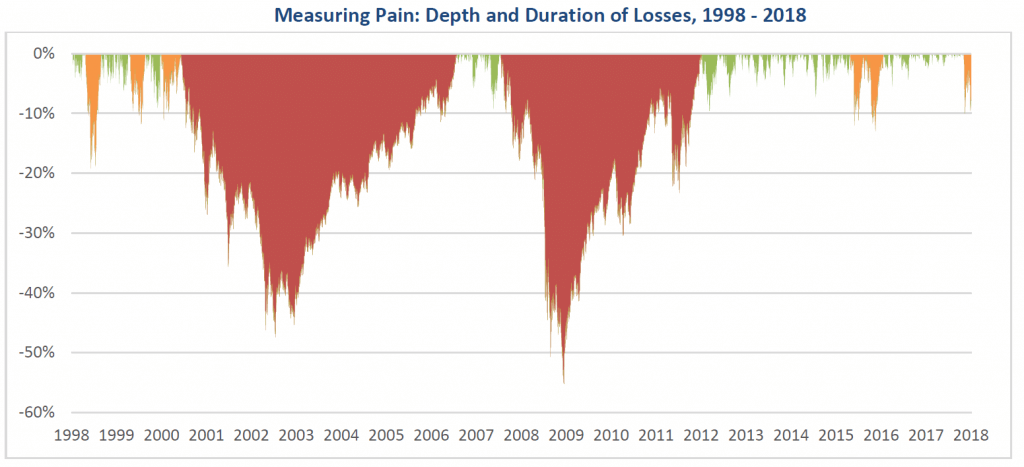
Source: Yahoo Finance, S&P 500 Total Return Index
The bear market during the Dot-com Bust of 2000-2002 may have created a smaller drawdown than the bear market during the Financial Crisis of 2008-09, but its duration was much longer. Tables A and B above show average duration of corrections can be less than a year while bear markets can go beyond four years.
If on average it takes less than a year for investors to move on from a correction, are corrections worth all the fuss?
In contrast, a bear market generally takes years before recovery is realized—and sometimes longer for the investor to mentally and emotionally recover. That sort of recovery time can seriously wreck a long-term investment plan or delay goals like retirement start dates or college education funding.
Corrections may happen more often, but on average, they tend to be less intense and shorter in duration. Generally, they do not derail investors from their financial goals.
Bear markets, on the other hand, are much more disruptive for people hoping to achieve their goals, resulting in major losses that take years to recover from. For those near or in the retirement phase, these losses can be particularly detrimental.
Corrections are often a wake-up call for investors to consider managing risk. But if investors and their portfolios are unable to withstand a 10% correction, are they prepared for the possibility of an actual bear market? With the recent panic surrounding the February 2018 correction, it seems many may not be adequately prepared.
The current market and volatility regime we’re in now suggests more uncomfortable downward moves may be ahead, which may make it harder for investors to hold on to a “buy-and-hold” strategy.
It’s our philosophy to hedge market risk directly in order to limit losses during bear markets and help investors remain invested and on track with their investment goals. We understand you can’t invest in risk assets and simultaneously protect against both smaller, short-term losses (corrections) and larger, longer-term losses (bear markets) and given the difference in the nature and impacts of corrections versus bear markets, we’ve chosen to seek protection from the latter.
We believe in managing against potentially life-altering losses to portfolios rather than seeking protection from what are often bumps on the investment journey.
David Lovell, Managing Director – Head of Marketing, is responsible for Swan’s brand, marketing, content, events, and media. David began his career in the financial industry at Mass Mutual, where he held life, health and disabilities insurance licenses, as well as, Series 6 and 63 licenses. David currently holds a Series 65 license.
Swan Global Investments, LLC is a SEC registered Investment Advisor that specializes in managing money using the proprietary Defined Risk Strategy (“DRS”). SEC registration does not denote any special training or qualification conferred by the SEC. Swan offers and manages the DRS for investors including individuals, institutions and other investment advisor firms. Any historical numbers, awards, and recognitions presented are based on the performance of a (GIPS®) composite, Swan’s DRS Select Composite, which includes non-qualified discretionary accounts invested in since inception, July 1997, and is net of fees and expenses. Swan claims compliance with the Global Investment Performance Standards (GIPS®).
All Swan products utilize the Defined Risk Strategy (“DRS”), but may vary by asset class, regulatory offering type, etc. Accordingly, all Swan DRS product offerings will have different performance results due to offering differences and comparing results among the Swan products and composites may be of limited use. All data used herein; including the statistical information, verification and performance reports are available upon request. The S&P 500 Index is a market cap weighted index of 500 widely held stocks often used as a proxy for the overall U.S. equity market. Indexes are unmanaged and have no fees or expenses. An investment cannot be made directly in an index. Swan’s investments may consist of securities which vary significantly from those in the benchmark indexes listed above and performance calculation methods may not be entirely comparable. Accordingly, comparing results shown to those of such indexes may be of limited use. The adviser’s dependence on its DRS process and judgments about the attractiveness, value and potential appreciation of particular ETFs and options in which the adviser invests or writes may prove to be incorrect and may not produce the desired results. There is no guarantee any investment or the DRS will meet its objectives. All investments involve the risk of potential investment losses as well as the potential for investment gains. Prior performance is not a guarantee of future results and there can be no assurance, and investors should not assume, that future performance will be comparable to past performance. All investment strategies have the potential for profit or loss. Further information is available upon request by contacting the company directly at 970-382-8901 or www.www.swanglobalinvestments.com. 149-SGI-041218
