In a world of instant updates and daily stock market news, investors often fixate on chasing short-term returns or “beating the market.” This leads to dependency on trailing returns to determine “how well” an investment is performing.
But for investors with long-term goals, their focus should be, “Will I achieve my long-term goal on time?” Because of this, advisors should use rolling returns rather than trailing returns when choosing or evaluating investments and managers.
The most common way of looking at returns in the investment industry is by using trailing returns. Trailing returns, or point-to-point returns, are a snapshot of the past, going back over a chosen period of time from a chosen anchor date, such as the latest quarter, 1-year, 3-year, or 5-year returns.
The problem with this approach is that It only measures a specified block of time. This can lead investors to expect future performance will mimic recent results, a phenomenon known as recency bias. With this late-stage bull market, what could investors expect going forward?
Our portfolio managers and analysts are dedicated to creating relevant, educational Articles, Podcasts, White Papers, Videos, and more.
If an investment or strategy just posted a really good quarter or year, that recent performance shines in the trailing return analysis. This is known as end-period dependency. However, if you were to move that anchor date you may find very different returns.
The following table shows various trailing returns through the end of March 2020 for the S&P 500 Index and the Bloomberg U.S. Aggregate.

Source: Zephyr StyleAdvisor
If you’re a financial planner basing decisions on these returns, it might be difficult to know what kind of expectations to set for your plan and how to frame the conversation with your clients. The difference among the short-term and long-term S&P 500 returns is quite vast. The 1-year return posted a -6.98% loss, while the 3-year was 5.10%, the 5-year was 6.73%, and the 10-year return boasted a 10.53% return.
That is not very consistent. For portfolios heavily tilted toward equities, this inconsistency could threaten financial plans and expectations.
If we look at the returns one year later, the 1-year return for the S&P 500 jumped to an eye-popping 56.35%. Just one year before it was at -6.98%. The variation is concerning, but even more problematic would be the anchoring of expectations on the new 1-year return. The 2, 3, 4, and 5-year returns from the previous year (March 2020) are also dramatically changed by March 2021.

Source: Zephyr StyleAdvisor
Another point to notice is the difference between the YTD and the 1-year returns of the Bloomberg U.S. Aggregate from March 2020 to March 2021. The dramatic swing from 3.15% to -3.37% on a YTD basis, and from 8.93% to 0.71% on a 1-year trailing basis, shows trouble may be ahead for bonds. However, the warning bells may be masked if one is only looking at the 3, 5, and 10-year trailing returns.
We see a similar difference with two years of difference in our snapshots, from 2020 through 2022. Taking a look at the S&P 500 again, the 1-year return has come back down from the stratospheric 56.35% figure in 2021 but was still a hefty 15.65% in 2022. While advisors may not base their long-term plan decisions on 1-year numbers, investors can often anchor their expectations to these numbers, causing them to regularly check in to make sure they’re reaching or “beating” the benchmark. Those are some high expectations to meet.

The S&P 500’s 3, 5, and 10-year returns for 2022 are all fairly in line with the respective 2021 returns, while the YTD as of March 2022 has turned negative. Meanwhile, the Bloomberg U.S. Aggregate returns are turning worse and the year over year numbers for the various intervals are showing more dispersion and dropping across the board.
When the performance conversation arises, framing the evaluation around short-term trailing returns can lead to defining success or portfolio changes based on too short a time frame. Whether we’re looking at 1-year trailing returns one year apart or considering the 1-, 3-, or 5- year returns in any given snapshot, the numbers are often vastly disparate and inconsistent, potentially skewing the returns expectations of investors and complicating long-term financial plan construction.
Couple that with short-term market noise and commentary, and investors can become all too eager to jump from one investment to another, chasing higher returns based on trailing 1, 3, and 5-year numbers. Further, investment or manager selection based on short-term trailing numbers can lead to disappointment or worse, unmet financial plans and goals.
The other problem with trailing returns is they don’t reflect the real investor experience or the real advisory experience. The reality is that investors do not start and stop their investment journeys at the same time (like, January 1st or December 31st of a given year, perhaps?). Two investors who begin with the same investment a quarter or two apart, much less a year or two apart, could have a very different experience. Evaluating recent trailing returns alone would not reflect this reality.
Instead of fixating on trailing returns or focusing on beating the market, a benchmark, or even a competing strategy in such short time frames, it may be better to redefine the conversation on returns to a more holistic measurement: rolling returns.
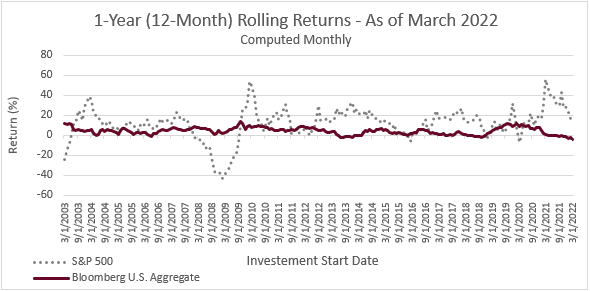
Rolling returns offer a more comprehensive view of returns: they consider returns over a fixed window within a larger time frame. For example, examining the average one-year rolling returns for a given investment can show you the experience investors would have had over any one-year period, even if they began investing at different times.
Source: Zephyr StyleAdvisor
The chart above shows the return an investor would have had if they held an investment in the S&P 500 or the Bloomberg U.S. Aggregate any 12-month period within the last 20 years.
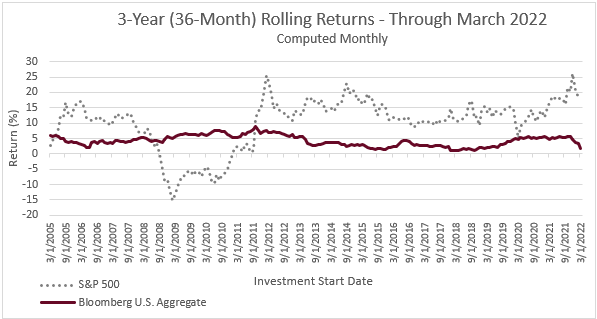
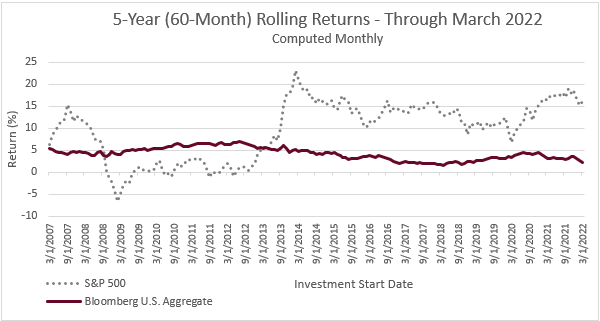
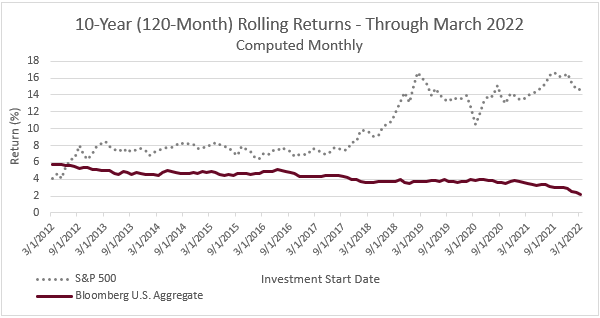
The chart below is the 3-year, 5-year, and 10-year versions of the rolling return chart for the same investments.
Source: Zephyr StyleAdvisor
Source: Zephyr StyleAdvisor
Source: Zephyr StyleAdvisor
Unlike trailing returns, rolling returns are less prone to end-period dependency and provide insight into the consistency of a manager’s strategy against a wider backdrop of market conditions. A strategy that has less variability of rolling returns over 3, 5, 10, and even 20-year periods is a strategy that may offer investors insight on potential investment experience in different market conditions.

Source: Zephyr StyleADVISOR
Where trailing returns can significantly fluctuate any given year, rolling returns show how consistent an investment is over time. Return disparity from year to year, or fixed period to fixed period, can make long-term financial planning difficult to implement and to maintain. If a given investment or strategy has generated consistent rolling returns across a range of longer periods, it may be worth considering adding such an investment to your portfolio.
Trailing only provide a “snapshot” of performance. Rolling returns give a more complete picture of what the investor experience would look as markets rise and fall. If rolling returns are consistent, investment timing risk is reduced.
Rolling returns also reveal the best and worst return of a particular investment so investors can manage their expectations. Seeing the best and the worst rolling returns over various time periods can give them a better sense of the fluctuations of their investments and whether they can stomach the volatility.
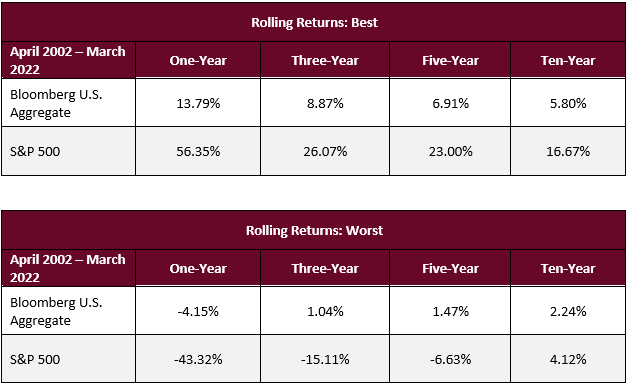
Source: Zephyr StyleADVISOR
While the best rolling period returns for the S&P 500 are impressive, the wide gaps between best and worst returns over various rolling periods make forming return assumptions and planning difficult. The worst rolling period returns may be frightening but helps investors better understand potential risks. Whether an investor is okay with that variability and loss potential may be an important factor to consider when creating financial plans and considering investor behavior.
Looking at rolling returns provides a better holistic view of returns and investment experiences over various market cycles and provides better expectations for manager performance. A large part of advising clients is managing their expectations and their emotions during stressful times. Using rolling returns may help advisors keep investors on track with their financial plans for longer.
Investing is about achieving long-term goals, not beating the market in the short term. Advisors should help investors take longer view of their investments’ performance and consider looking at different measurements of returns or benchmarks.
Rolling returns, especially those spanning longer-term periods (5, 10, 15, 20 years or more), can help advisors redefine the discussion around performance and focus client perspectives on longer-term outcomes. This may lead to improved investor expectations, keeping them on track with financial plans, and maintaining a better client relationship.
Swan Global Investments, LLC is a SEC registered Investment Advisor that specializes in managing money using the proprietary Defined Risk Strategy (“DRS”). SEC registration does not denote any special training or qualification conferred by the SEC. Swan offers and manages the DRS for investors including individuals, institutions and other investment advisor firms.
All Swan products utilize the Defined Risk Strategy (“DRS”), but may vary by asset class, regulatory offering type, etc. Accordingly, all Swan DRS product offerings will have different performance results due to offering differences and comparing results among the Swan products and composites may be of limited use. All data used herein; including the statistical information, verification and performance reports are available upon request. The S&P 500 Index is a market cap weighted index of 500 widely held stocks often used as a proxy for the overall U.S. equity market. The Bloomberg US Aggregate Bond Index is a broad-based flagship benchmark that measures the investment grade, US dollar-denominated, fixed-rate taxable bond market. The index includes Treasuries, government-related and corporate securities, MBS (agency fixed-rate and hybrid ARM pass-throughs), ABS and CMBS (agency and non-agency). Indexes are unmanaged and have no fees or expenses. An investment cannot be made directly in an index. Swan’s investments may consist of securities which vary significantly from those in the benchmark indexes listed above and performance calculation methods may not be entirely comparable. Accordingly, comparing results shown to those of such indexes may be of limited use. The adviser’s dependence on its DRS process and judgments about the attractiveness, value and potential appreciation of particular ETFs and options in which the adviser invests or writes may prove to be incorrect and may not produce the desired results. There is no guarantee any investment or the DRS will meet its objectives. All investments involve the risk of potential investment losses as well as the potential for investment gains. Prior performance is not a guarantee of future results and there can be no assurance, and investors should not assume, that future performance will be comparable to past performance. Further information is available upon request by contacting the company directly at 970-382-8901 or www.swanglobalinvestments.com.
234-SGI-072022