This site uses cookies. By continuing to browse the site, you are agreeing to our use of cookies. Privacy Policy
Okay, thanks
The last couple of years have been great for the U.S. stock market, if one looks simply at the year-end results. The S&P 500 Index finished 2019, 2020, and 2021 with annual returns of 31.5%, 18.4%, and 28.7%, respectively. However, the market experienced periods of significant volatility within those years.
In 2022, investors are seeing plenty of volatility and the many stock market forecasters are predicting more volatility on the horizon. But what does volatility mean, and why does it matter to investors? We’ll explore those important questions and more.
People use averages all the time. But the problem with averages is that averages will inevitably mask some important details. Consider the following example:
Suppose we have two running backs, and at halftime these were their stats.
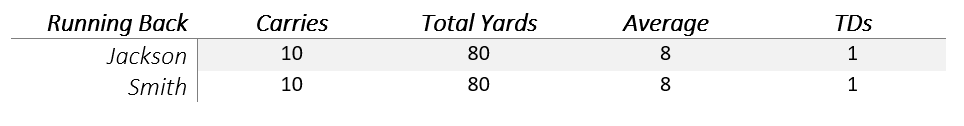
At first glance someone might look at this stat-line and assume that these running backs had identical games. However, what if Jackson was stuffed for no gain on nine plays but had one breakout run of 80 yards? And what if Smith was given the ball ten times and picked up eight yards on every single one of his ten carries?
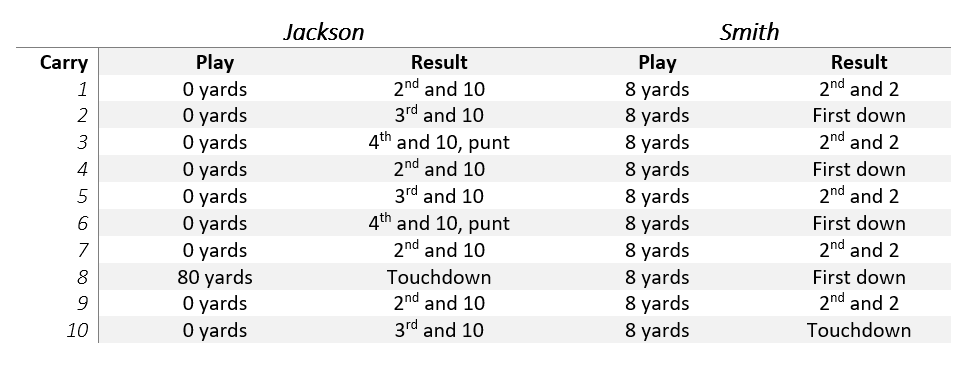
Given that additional information, who would you rather have on your team? For most people, it would be the consistency of Smith rather than the “boom-or-bust” running of Jackson.
This is a simplified example, but it illustrates an important point: averages conceal the details.
This idea of “averages concealing the details” extends to the financial markets too.
Let’s look at two recent years: 2017 and 2020. Both years were very good for the market, delivering returns roughly twice the long-term average of the S&P 500. However, the routes the market took to get to that end point were very different.
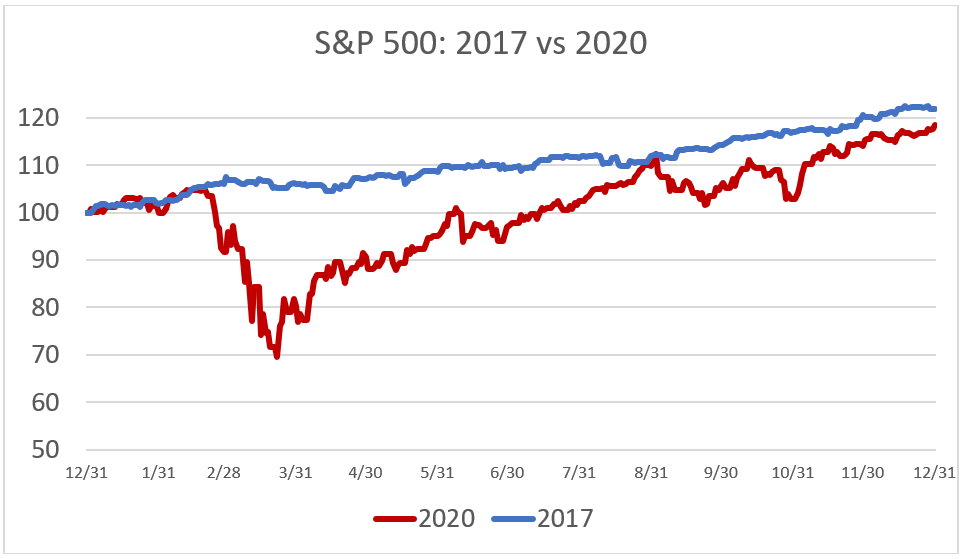
Source: Zephyr StyleADVISOR, Swan Global Investments
In 2017 the U.S. stock market achieved a feat never seen before: all 12 months of the year were positive. Month after month the S&P 500 ground higher and by the end of the year the market finished up 21.8%.
In sharp contrast to 2017 was the pandemic year of 2020. In 2020 the S&P 500 posted an 18.4% return: an excellent return and not far below the results of 2017. However, the path the market took to get to that point couldn’t have been more different. As the panic surrounding the Covid-19 Pandemic swept the globe in February and March the S&P 500 lost almost a third of its value. Markets then rallied strongly and finished 2020 very much in the black.
This variability is known as volatility. Volatility is a statistical measure of the frequency and magnitude of price movements, both up and down, that a financial instrument (stock, bond, index, etc.) experiences over a period of time. Volatility can also show how much the price movement of an investment deviates from its long-term average. The higher the volatility, the less representative the average is of the day-to-day experience. Conversely, if volatility is low, it means the day-to-day experience tracks the average rather closely.
As investors, it would be useful for us to know:
Figuring out what volatility has been in the past is easy to calculate but of limited use to the investor. Known as “historic volatility”, all one needs to do is collect data on previous price moves or actual returns, and apply a well-known calculation called standard deviation to calculate historic volatility.
A bigger challenge is trying to anticipate what volatility is going to be. This is hard to do but would be much more useful to the investor. Obviously, no one has a crystal ball so it is impossible to measure what has yet to happen. However, there are some indicators that market watchers use to anticipate how volatile markets will be in the future.
This estimate of future volatility is known as “implied volatility.” To estimate implied volatility, investors seek out clues in the options market.
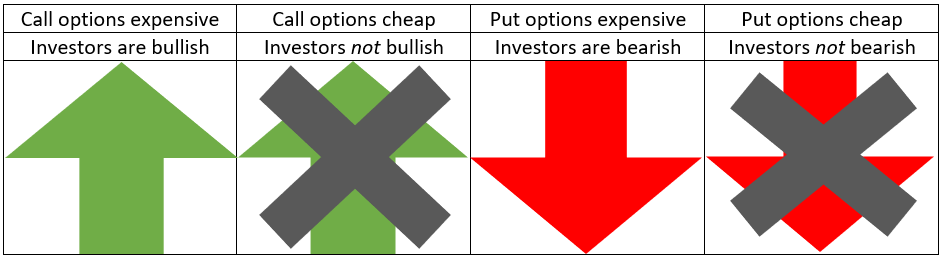
Options are financial instruments that are worth a lot if the markets move up (call options) or if the market moves down (put options). If markets don’t move significantly, then options are worthless.
By tracking the prices of options, investors can get a feel for market sentiment.
If the prices of call options are expensive, that indicates there is a bullish tilt to the market and investors are anticipating a strong upward move in the market. Conversely, if put options are expensive, that means investors are bearish and are betting on a big downward move in the market.
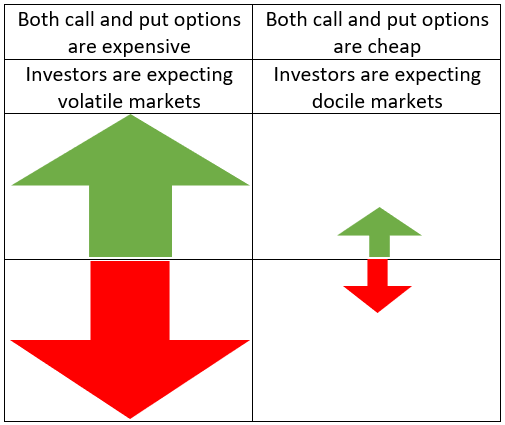
If both call options and put options are cheap, this indicates that investors are thinking the markets will be relatively docile and won’t make a big move up or down.
Finally, if both call options and put options are expensive, that means investors don’t know if markets are going up or down, but they are expecting a wild ride over the foreseeable future.
The prices of both call options and put options are aggregated and measured in an index known as the VIX Index. Just like the S&P 500 is a basket of the prices of 500 stocks, the VIX index is a basket of average prices of a batch of options.
By tracking the VIX, investors can get an indication of just how volatile investors are anticipating the market will be, going forward. A low VIX level implies that investors are anticipating relatively quiet markets; a high VIX level implies investors are foreseeing big price swings (volatility) in the markets.
This is why the VIX is said to measure implied volatility. We can’t measure future volatility because it hasn’t happened yet. But we can gauge the anticipated future volatility by seeing what is implied by the prices of the call options and put options used in the VIX index.
This is also why the VIX is often referred to as “the fear gauge.” Uncertainty and volatility equate to fear.
It is important to keep in mind that that volatility is just one way to measure risk. Drawdown risk is the risk of losing money. Longevity risk is the risk of outliving your money. Inflation risk is the risk that prices go up and the purchasing power of your money deteriorates. A well-developed financial plan should take in to account all of these risks.
Volatility is a commonly used word in the investment news and financial media. More importantly, volatility is a driver of the emotions an investor feels. It is important for investors to understand what volatility is, how it’s measured, and ways to address risks associated with market volatility within their portfolio.
If you are worried about volatility or market sell-offs, perhaps consider adding strategies that mitigate volatility, like hedged equity, to your portfolio. A hedged equity strategy is typically invested in the market but hedges the exposure to market risk with put options. As discussed earlier, put options tend to increase in value when markets are volatile or decline. By owning put options, a hedged equity strategy seeks to reduce volatility (price swings) in order to smooth the investment experience versus the price swings experienced by the market.
Marc Odo, CFA®, FRM®, CAIA®, CIPM®, CFP®, Client Portfolio Manager, is responsible for helping clients and prospects gain a detailed understanding of Swan’s Defined Risk Strategy, including how it fits into an overall investment strategy. His responsibilities also include producing most of Swan’s thought leadership content. Formerly Marc was the Director of Research for 11 years at Zephyr Associates.
Our portfolio managers and analysts are dedicated to creating relevant, educational Articles, Podcasts, White Papers, Videos, and more.
Swan Global Investments is an SEC registered Investment Advisor that specializes in managing money using the proprietary Defined Risk Strategy (DRS). Please note that registration of the Advisor does not imply a certain level of skill or training. All investments involve the risk of potential investment losses as well as the potential for investment gains. Prior performance is no guarantee of future results and there can be no assurance that future performance will be comparable to past performance. This communication is informational only and is not a solicitation or investment advice. Further information may be obtained by contacting the company directly at 970-382-8901
or www.swanglobalinvestments.com. 074-SGI-021522