One of the challenges facing today’s investors and financial advisors has to do with understanding the role of alternative investments within a portfolio.
To address this challenge, Swan Global Investments will provide a series of blog posts over the coming months to compare and analyze various types of alternative strategies and categories. We seek to answer the most important questions in each type of strategy, namely:
Every winter, college football fans around the nation eagerly await National Signing Day, when the nation’s top
prospects announce their initial commitment to a university. I’m always intrigued by those kids who aren’t recruited to play a specific position, but are simply listed as an “athlete.”
When it comes to judging the potential of a quarterback or defensive end, the analytical metrics used are pretty standardized and straightforward: speed, strength, body dimensions, etc. But with certain prospects, it’s hard to know just where they should fit on a team. Offense or defense? Every-down player or specialty situations? Everyone knows Christian McCaffrey or Jabrill Peppers will make a team better, but not everyone knows how to best utilize a multi-dimensional talent on a team.
These athletes are hard to classify, just as liquid alternatives are hard to classify.
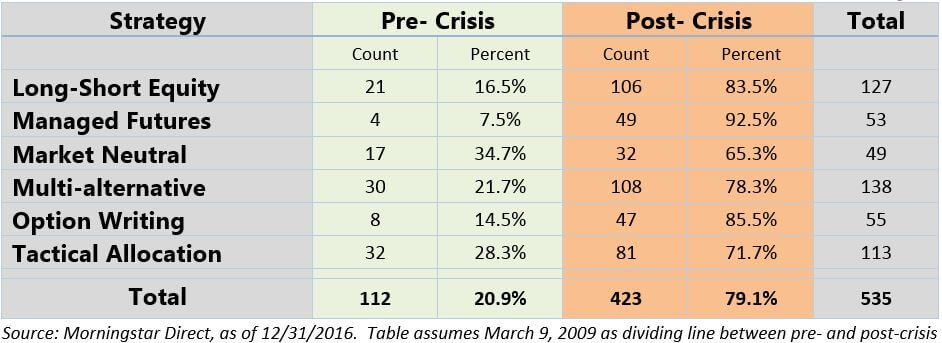
Since the Financial Crisis of 2007-09 when most equity managers lost money in lock-step with the broad market, there has been an explosion of strategies whose only common thread or similarity is that they are “doing something different.”

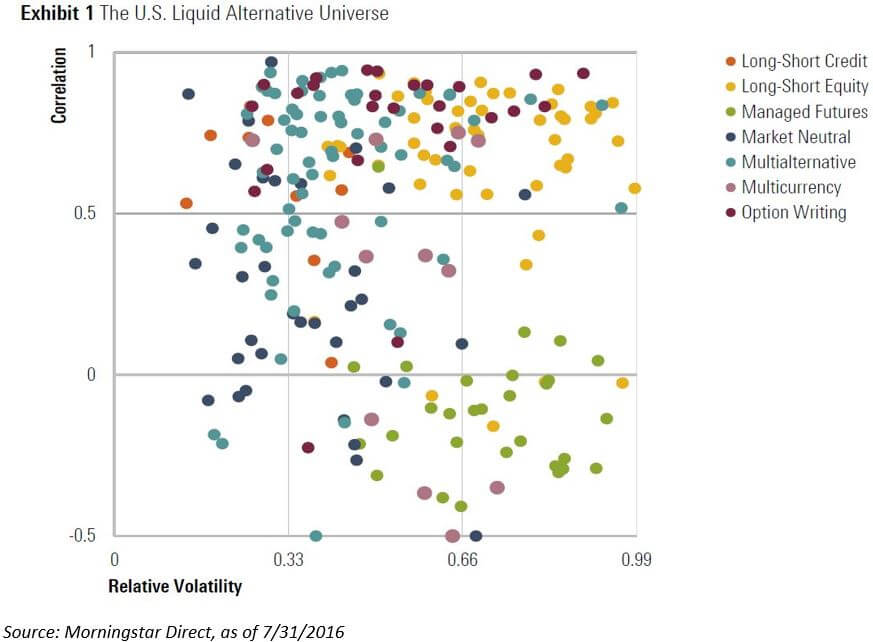
The loose definition of alternative or liquid alt makes understanding or analyzing them very tricky. These strategies are unique and wide-ranging. In 2016, Morningstar expanded their liquid alternative framework by adding several new categories and creating an alternative style box to complement their work in traditional investments.

The “value proposition” of alternatives varies greatly.
For example, some strategies try to short underperforming stocks as well as own outperforming stocks. The drivers of return in long/short strategies are primarily at the individual stock level.
Other strategies make top-down decisions and reallocate their portfolios based upon the anticipated relative performance of asset classes.
I could go on, but the point is that broad definition of “liquid alternatives” encapsulates many different strategies and trying to understand all the factors at play becomes very difficult to manage.
Any experienced financial professional will tell you return is closely related to risk. The risks will be directly linked to how they generate returns.
If a long-short strategy has a value-bias, what happens when growth is in favor?
What happens when a tactical asset allocator’s predictive model breaks down?
What happens to an option strategy when a short position goes in-the-money?
These are the kinds of things that will be explored in a case-by-case analysis.
As with return and risk, the role of an alternative within a portfolio will vary depending upon the broad type of strategy and the unique characteristics of an individual strategy. Broadly speaking, most professionals view alternatives as either beta-reducers or alpha-drivers…defense or offense, to return to our football analogy.
However, the biggest problem is that alternative investments typically don’t make up a large enough allocation to have a significant impact on the end results of a portfolio.
If alternatives are used, they tend to be in the 10%-20% range of an overall portfolio. Moreover, many practitioners divvy up their alternative allocation amongst several or many managers, diluting the impact any one manager can have on a portfolio.
When Swan first developed the Defined Risk Strategy, the original intent was that it would be a total portfolio solution. These days, we most frequently position the DRS as a core equity position – one with large cap characteristics, downside protection, and a significant weighting in a portfolio.
That said, the use of options and the fact that the DRS return patterns don’t closely track the S&P 500 when using metrics like beta, R-Squared, and correlation leads some to classify the DRS as a liquid alternative. These themes are explored in-depth in Swan’s recent white paper, “Where Does Hedged Equity Fit?”
Given the lack of understanding of alternatives and the challenges described previously, perhaps it is no surprise that many investors have been reluctant to dedicate a significant allocation to strategies that are “different.”
To return to our original analogy, Stanford or Michigan wouldn’t have won as many games had they kept McCaffrey or Peppers on the bench. Those kinds of players were game-changers only when they were in the game.
The objective of this Strategy Comparison blog series is to help investors, and advisors, better understand these non-traditional strategies and how they compare and contrast to the DRS when making portfolio decisions. See our previous posts on:
Marc Odo, CFA®, CAIA®, CIPM®, CFP®, Client Portfolio Manager, is responsible for helping clients and prospects gain a detailed understanding of Swan’s Defined Risk Strategy, including how it fits into an overall investment strategy. Formerly Marc was the Director of Research for 11 years at Zephyr Associates.
Swan Global Investments, LLC is a SEC registered Investment Advisor that specializes in managing money using the proprietary Defined Risk Strategy (“DRS”). SEC registration does not denote any special training or qualification conferred by the SEC. Swan Global Investments offers and manages the Defined Risk Strategy for investors including individuals, institutions and other investment advisor firms. All Swan products utilize the Swan DRS but may vary by asset class, regulatory offering type, etc. Accordingly, all Swan DRS product offerings will have different performance results and comparing results among the Swan products and composites may be of limited use. Indices are unmanaged and cannot be invested into directly. Past performance is no guarantee of future results. DRS results are from the Select Composite, net of fees, as of 12/31/2016. The charts and graphs contained herein should not serve as the sole determining factor for making investment decisions. Hypothetical performance analysis is not actual performance history. Actual results may materially vary and differ significantly from the suggested hypothetical analysis performance data. This analysis is not a guarantee or indication of future performance. Swan claims compliance with the Global Investment Performance Standards (GIPS®). Any historical numbers, awards and recognitions presented are based on the performance of a (GIPS®) composite, Swan’s DRS Select Composite, which includes nonqualified discretionary accounts invested in since inception, July 1997 and are net of fees and expenses. All data used herein; including the statistical information, verification and performance reports are available upon request.
The benchmarks used for the DRS Select Composite are the S&P 500 Index, which consists of approximately 500 large cap stocks often used as a proxy for the overall U.S. equity market, and a 60/40 blended composite, weighted 60% in the aforementioned S&P 500 Index and 40% in the Barclays US Aggregate Bond Index. The 60/40 is rebalanced monthly. The Barclays US Aggregate Bond Index is a broad-based flagship benchmark that measures the investment grade, US dollar-denominated, fixed-rate taxable bond market. The index includes Treasuries, government-related and corporate securities, MBS (agency fixed-rate and hybrid ARM pass-throughs), ABS and CMBS (agency and non-agency). Indexes are unmanaged and have no fees or expenses. An investment cannot be made directly in an index. Swan’s investments may consist of securities which vary significantly from those in the benchmark indexes listed above and performance calculation methods may not be entirely comparable. Accordingly, comparing results shown to those of such indexes may be of limited use.
The advisor’s dependence on its DRS process and judgments about the attractiveness, value and potential appreciation of particular ETFs and options in which the advisor invests or writes may prove to be incorrect and may not produce the desired results. There is no guarantee any investment or the DRS will meet its objectives. All investments involve the risk of potential investment losses as well as the potential for investment gains. Prior performance is not a guarantee of future results and there can be no assurance, and investors should not assume, that future performance will be comparable to past performance. Further information is available upon request by contacting the company directly at 970.382.8901 or visit www.swanglobalinvestments.com. 061-SGI-030317