For decades the financial industry has promoted diversification as the most logical, prudent way to maximize returns and minimize risk. However, in order to truly reap the benefits of diversification, a strategic investment plan must be implemented correctly.
Without proper implementation, diversification will likely not yield its purported benefits.
For many investors, diversification meant investing across a wide array of investment styles or asset classes. Frequently some sort of optimization algorithm was utilized to maximize the trade-off between expected returns and expected risks. Lynchpin to this approach is the key role that correlation plays in the equation. The benefits of diversification are realized only if the investments truly behave differently from one another.
Unfortunately, many investors pursued “false diversification”, or a diversification strategy that involved simply ‘slicing and dicing’ the market.
One widely followed form of false diversification was to slice up the market into smaller and smaller pieces while neglecting to move the eggs out of the proverbial basket.
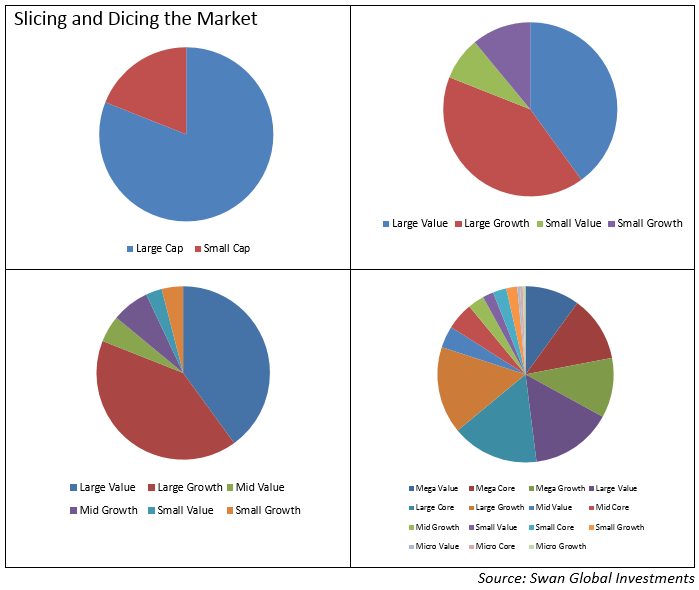
As the chart below displays, initially, investors divided equity markets into large cap and small cap “styles”. Next, a value and growth distinction was made. Eventually, the concepts of mid-cap and core were added to the style mix.
Splitting the hairs even further, concepts like mega-cap, micro-cap, “SMID”-cap, deep value, relative value, growth-at-a-reasonable-price, and momentum-growth were all incorporated into the concept of diversification. However, none of these styles were truly new assets: they were simply smaller slices of the same pie.

As noted above, true diversification is achieved when two or more investments exhibit different responses to market moves.
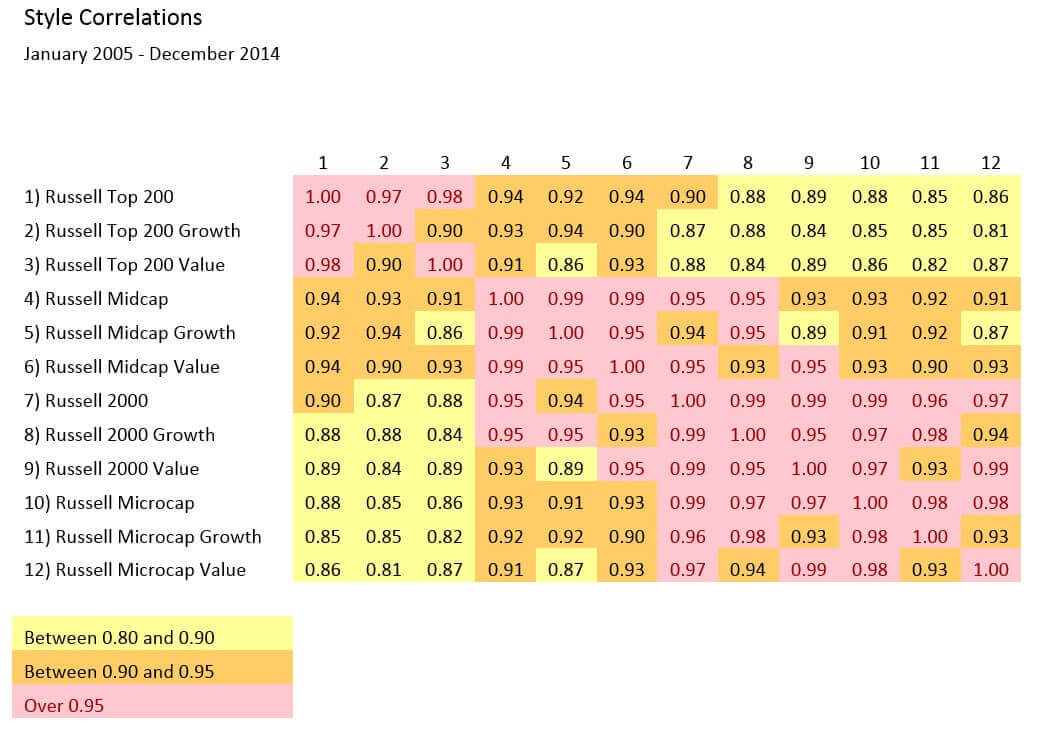
The table below shows how highly correlated all of these styles, or slices of the market pie, are to one another. Correlations between +0.80 and +0.90 are highlighted in yellow, between +0.90 and +0.95 in orange and above +0.95 in red.
No two styles have correlations less than +0.80, severely limiting the diversification potential of these investments.

Investors with assets across each of these “styles” probably felt great when markets were going up and likely assumed diversification was working as advertised. But the simple and neglected truth was that if everything was going up at the same time, they would very likely all go down at the same time. And of course, that’s exactly what happened.
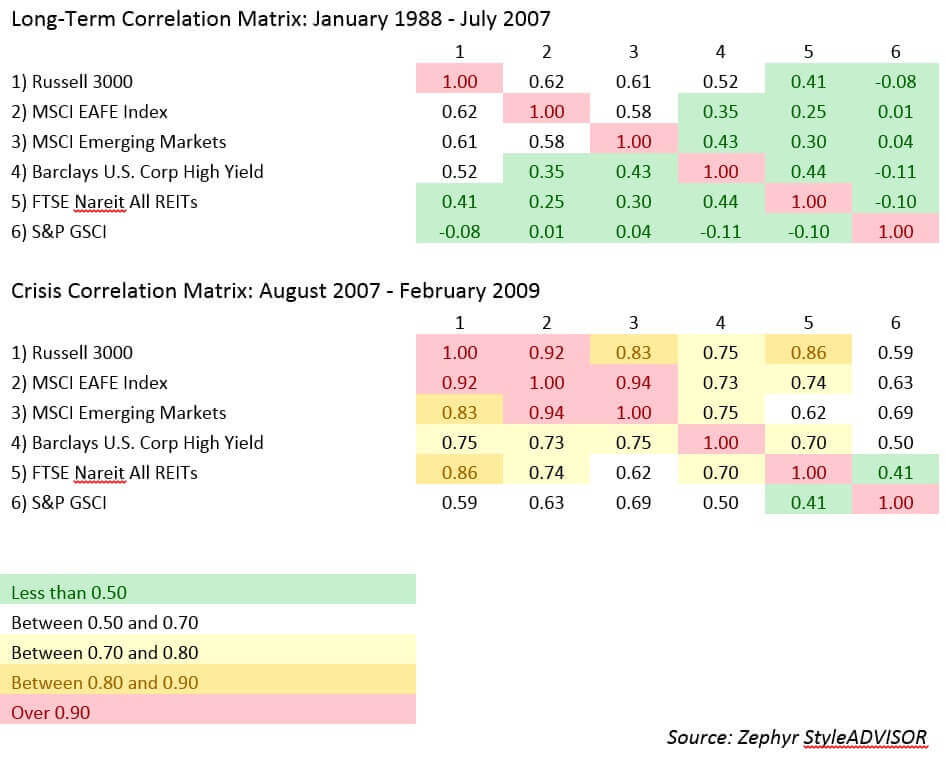
Even investors who moved into other asset classes like international stocks, emerging market stocks, high yield bonds, real estate, and commodities saw those investments plunge in lock-step with their US equity investments during the 2008 crisis. When portfolio diversification was needed most, the correlations spiked. The two tables below display how correlations shifted from their long-term averages during the crisis of 2008:

The dampening of a portfolio’s overall volatility is only possible if the constituents of a portfolio have low or, ideally, negative correlations. In a follow-up blog post, we will explore the mathematical underpinnings of correlation. Suffice it to say, a well-constructed diversification strategy should have losses in one portion of the portfolio offset by gains in another.
Swan Global Investments, LLC is a SEC registered Investment Advisor that specializes in managing money using the proprietary Defined Risk Strategy (“DRS”). SEC registration does not denote any special training or qualification conferred by the SEC. Swan offers and manages the DRS for investors including individuals, institutions and other investment advisor firms. Any historical numbers, awards and recognitions presented are based on the performance of a (GIPS®) composite, Swan’s DRS Select Composite, which includes nonqualified discretionary accounts invested in since inception, July 1997, and are net of fees and expenses. Swan claims compliance with the Global Investment Performance Standards (GIPS®). All data used herein; including the statistical information, verification and performance reports are available upon request. The S&P 500 Index is a market cap weighted index of 500 widely held stocks often used as a proxy for the overall U.S. equity market. Indexes are unmanaged and have no fees or expenses. An investment cannot be made directly in an index. Swan’s investments may consist of securities which vary significantly from those in the benchmark indexes listed above and performance calculation methods may not be entirely comparable. Accordingly, comparing results shown to those of such indexes may be of limited use. The adviser’s dependence on its DRS process and judgments about the attractiveness, value and potential appreciation of particular ETFs and options in which the adviser invests or writes may prove to be incorrect and may not produce the desired results. There is no guarantee any investment or the DRS will meet its objectives. All investments involve the risk of potential investment losses as well as the potential for investment gains. This analysis is not a guarantee or indication of future performance. Prior performance is not a guarantee of future results and there can be no assurance, and investors should not assume, that future performance will be comparable to past performance. Further information is available upon request by contacting the company directly at 970.382.8901 or visit www.swanglobalinvestments.com. 061-SGI-030317