Sep. 13, 2022
Why Inflation Remains Persistent and Strategies to Tackle It
Today’s CPI print signals an underlying trend of ‘sticky inflation’ that has markets and investors raising caution flags. While the headline CPI fell from 8.5% to 8.3%, the index for “all items less food and energy (a.k.a core CPI) rose 0.6% in August, a larger increase than in July.
While the gasoline index fell 10.6%, the increases in the shelter, food, and medical care indexes were the largest of many contributors to the broad-based monthly “all items” index increase.
This news is unsettling for markets as investors are now considering just how ‘sticky’ inflation may be, and for how long.
As inflation began rising early in 2021, experts at the Fed and Treasury Department said there was little concern it would stick around for long and that inflation would likely fall by mid-2022 (think “transitory”). However, as 2021 dragged into 2022 and the monthly PPI, CPI, and PCE numbers (headline and core) increased steadily, the experts changed their tune.
As of the fall of 2022, we’re seeing more forecasts from FOMC members like St. Louis Federal Reserve President James Bullard to market movers like Larry Fink indicating elevated levels of inflation may remain persistent or ‘sticky’ for years to come.
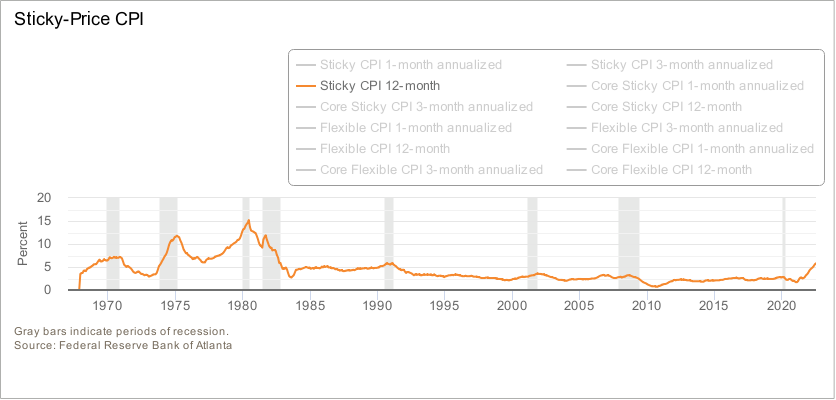
The chart below is referred to as the ‘sticky-price’ gauge used by the Federal Reserve Bank of Atlanta to track the degree to which inflation is baked into the overall economy. “Atlanta, we may have a problem...”

Many market participants and economists have indicated they believe we’ve seen peak inflation in the U.S. Whether or not the inflation rate has truly peaked remains to be seen.
However, the real challenge for investors going forward is not whether inflation moderates from 8.5% in July 2022 (headline CPI) to 8.3% in August or even 7% in the coming months, but the potential specter of a protracted period of ‘elevated’ inflation well above the Fed’s target of 2.0%.
Persistently elevated inflation may eventually take a greater toll on consumers and the economy. Investors should therefore consider strategies to address an environment of ‘sticky’ inflation.
Our portfolio managers and analysts are dedicated to creating relevant, educational Articles, Podcasts, White Papers, Videos, and more.
Typically, higher prices themselves tend to be a “cure for higher prices” as the economic forces of supply and demand find an equilibrium. From the demand side, demand tends to drop as prices rise, which creates too much supply and then eventually prices fall. Meanwhile, on the supply side, high prices attract more suppliers and competing methods of lower-cost production (that pesky profit motive at work), which in turn typically drives more supply and lower prices.
However, we’re obviously not in a typical environment.
On August 27th, Jerome Powell’s 8-minute speech during this year’s Economic Policy Symposium in Jackson Hole, included a forecast for “some pain” ahead for households and businesses. The equity market reacted swiftly—investors realized that “pain” is not in line with the assumptions building since late June that rate hikes would end soon, a mild recession this year or early next year would ease demand and inflation, followed by another ‘Powell Pivot’ to lower rates. It became clear that the FOMC is focus on reducing inflation and willing to raise rates during an economic slowdown (not typical FOMC behavior).
The environment is atypical in other ways that may delay a return to lower levels of inflation.
A global pandemic of a novel virus is not typical. Neither was the response. Increased government intervention in global markets such as, mandated lockdowns, historic fiscal and monetary stimulus, large-scale industry regulation and investment influences in the form of ESG and related SEC rules, along with rapid adoption of green energy policies, are having an effect on supply and demand.
So, while a recession typically means less demand and economic growth, the level of supply for many goods and services may remain lower for much longer. That could lead to stagflation. Few would consider that a “cure” for anything.
Several factors are colliding to create what may become persistent, elevated levels of inflation. These factors are not short-term in nature.
At the macro level, policy factors and structural changes occurring in the global economy are likely to create a stubborn and elevated inflation regime that may last for many years, namely: green energy policies; unrelenting war in Ukraine that is exacerbating supply chains strained since COVID; and a shift to deglobalization. To complicate matters, the first two may lead to energy shortages and/or food shortages here in the US and globally.
1) Green energy policies, like the 2030 Agenda for Sustainable Development adopted by most of the Eurozone, the US, Australia and many developing nations, coupled with a globally-proselytized ESG framework have effectively reduced investing in, and the production of, fossil fuel-based energy sources. The near-term effect of these policies is reduced energy supply, which is driving energy prices higher and the overall inflation rate along with it.
Higher energy prices are a kill shot for food production. Diesel and gasoline price inflation drives higher input (fertilizer, seed, etc.) and production costs for farmers, food processors and transportation services. These higher costs translate into higher prices to the end consumer. Green policies, seen in the EU, Canada, Sri Lanka, and nations around the world also limit use of synthetic fertilizers. Putting the efficacy of this policy aside, it reduces crop yield and increase food prices. Worse still, the World Bank has already declared a global food crisis and predictions of food shortages and famines are surfacing.
It is worth noting, and today’s reading for core CPI suggests, that higher energy prices generally bleed into everything else. One can strip out energy price increases from CPI or CPE simply by removing household energy and motor fuels. But that’s just moving numbers around, it does not reflect the reality felt by consumers who power nearly 70% of the US economy.
1) The consumer can’t strip energy costs out of their budget.
– As of the date of this post, over 20 million Americans are behind on their energy bills.
– And in the UK, 34% of consumers are reducing expenditures as they get squeezed by higher energy prices, or choosing between eating or heating their home.
2) Higher energy costs generally cause pain on down the supply chain, increasing prices for many necessities, food, or other regularly consumed items.
– Spot prices for various types of fuels remain elevated since early 2022, even with recent declines spurred by fears of global slowdown
– Prices for many food products, transportation (i.e., airline tickets and fees), and services that rise with higher energy costs often do not drop or drop as quickly as oil prices may.
2) COVID-induced supply shocks linger still today, but Russia’s invasion of Ukraine has exacerbated supply issues for energy, minerals, and food. Ukraine and the western region of Russia bordering Ukraine account for about 30% of global wheat production. The war triggered huge price spikes in global grain markets. While Russia accounts for only about 8% of global oil supply, prior to the war it supplied nearly 50% of the coal, 40% of the natural gas and much of the enriched uranium imported by Europe. Europe and the US are in a bind—they want to hamstring Russia with oil export price caps, but need the flow of Russian gas to Europe.
A winter of discontent looms over Europe indeed. As of the posting of this blog, the war drags on, Russia has turned off Europe’s main gas pipeline, and we’re heading into winter—increasing the sense of urgency for European leaders who are witnessing spikes in energy costs, forecasts of food shortages, and potential civil unrest. Worse still, the war’s ramifications are far-reaching, potentially causing starvation in and mass migration from Africa and the Middle East.
There doesn’t appear to be any short-term resolution for the war or its consequences.
3) Friend-Shoring / Deglobalization is becoming a trend that will likely drive prices higher. This trend has grown in response to two major factors:
Deglobalization will likely unwind the cost savings previously enjoyed by the developed nations during the previous era of globalization, creating further upward pressure on prices even if supply shortages are eventually abated.
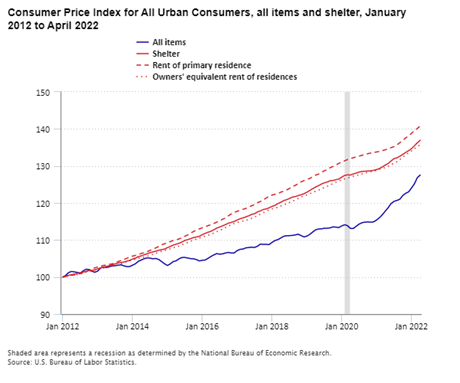
At a domestic level, a key ingredient of sticky inflation is shelter cost increases, which have risen mightily since the COVID-19 pandemic.

According to the Bureau of Labor Statistics, shelter costs are up 5.6% over the past 12 months, the most since 1991, and steadily outpacing the ‘all items’ index for all urban consumers since 2012.
The Federal Reserve Bank of Dallas predicts rental inflation rising at a 6.9% year-over-year rate by December 2023.
The concern for investors, corporate leaders, and policymakers alike is whether or not this higher level of inflation (well above the Fed’s target of 2.0%) has become structural and therefore truly sticky and difficult to unwind?
 Even if inflation falls yet remains elevated, say around the 4-6% level, that still causes significant erosion of buying power and a threat to economic growth over time. At 5% inflation, in the span of just 5 years, consumers will lose 20% purchasing power!
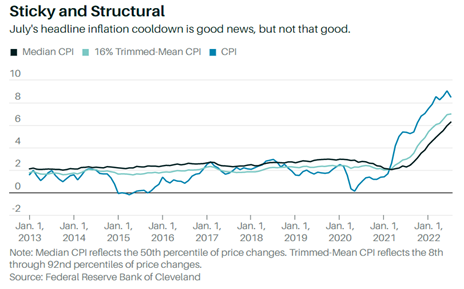
The core CPI reading is a good indicator of the ‘stickiness’ of inflation. Although the recent headline July 2022 inflation fell from the 9.1% level in June of this year, in large part to a reduction in oil prices (energy index fell 4.6 from June), the core inflation reading actually ticked up slightly from June’s reading (albeit a lower increase in core CPI than the 0.7 move from May to June), and it ticked up again per today’s August CPI report.
The FOMC is ill-equipped to address supply issues in the economy. Housing inventories are low across the nation. As such rising rents or shelter costs appear poised to persist as a key element of sticky inflation.
Price stability is one of the Federal Reserve’s two mandates. But if their monetary tools are unable to directly address key factors creating today’s sticky inflation, such as foreign wars, supply shocks, ‘green’ energy policy ramifications, or rising rents, then investors should consider how to seek growth and preservation of capital in such an environment.
Put simply, as the cost-of-living swells, a portfolio’s real returns decline. This is of particular concern to retirees living on a fixed income.
Rising prices also impact corporate profits, so in general, rapidly rising inflation and persistently elevated inflation levels are usually negative for stocks. For example, between 1973 and 1981, inflation rose by more than 9% a year. During the same period, the S&P 500 shed about 4% annually.
Through this period, the traditional 60/40 portfolio (60% stocks/40% bonds) was down 19.4% year-to-date through the end of August, on track for its worst year since 1936, its worst performance in decades. Thus, investors are increasingly considering different strategies and portfolio adjustments.
So what are your options?
Treasury Inflation-Protected Securities (TIPS): TIPS are designed to protect your investment from inflation. The U.S. Treasury sells TIPS and annually adjusts their par value to track inflation. This increases the interest payments investors enjoy and ensures your purchasing power isn’t eroded. However, these investments will not necessarily provide capital appreciation, and interest payments will decrease as inflation falls.
Value Stocks: Companies that appear to be trading at a low price relative to their fundamentals (dividends, earnings, sales, book value, etc.). These companies, often in industries such as the financial and consumer staples sectors, may be less affected by inflation and/or tend to have pricing power.
Dividend-Paying Stocks: Companies that can pay a hefty dividend, at or near the rate of inflation, help offset the erosion in buying power. There are lists of ‘dividend darlings’ or companies with very high dividend yield. However, on balance, many dividend-paying stocks can be sensitive to interest rate fluctuations and inflation, while some may be forced in time of economic stress to reduce or cut their dividends altogether.
Real Estate: Another tried-and-true inflation hedge is real estate given it’s necessity (which lends itself to the ability to rent it) and scarcity—as the saying goes, “they aren’t making any more of it.” Rates of rental growth generally increase over time as populations increase and supply of new property typically declines in times of high inflation. The scarcity itself helps to drive appreciation of land and developed real estate. Generally speaking, high rates of inflation increase building costs, which drive prices higher for new properties, thus pulling prices of existing properties higher. Lastly, real estate does not typically correlate too closely with bonds or stocks.
Hard Assets – Gold, Silver, Other Metals, Diamonds & Gemstones, Fine art, Collectibles: Gold is heralded as “the inflation hedge”, as it has intrinsic value (never goes to zero), does not corrode like Silver, has many industrial and commercial uses, and has served both as currency and as the underlying value against which currencies have been based for millennia. Silver, Platinum, Palladium and other metals can serve as an inflation hedge and investable asset given they too have industrial and commercial uses. Diamonds and gemstones tend to retain their value and can serve as a means of exchange when currencies or economies collapse and chaos ensues. Fine art and other collectibles (cars, jewelry, antiques, memorabilia, etc.) can be a store of value when inflation eats away at a currency.
Option-Based Strategies, like Hedged Equity: The universe of hedged equity strategies is pretty vast, but in general, hedged equity refers to investment strategies that invest in equity securities and seek to provide some hedge against losses. The objective for investors in time of high inflation, who cannot know when inflation will subside or when the equity markets will begin to price in a recovery, is to remain invested to seek whatever gains they can to offset erosion of purchasing power.
Persistently elevated rates of inflation can be troublesome for nearly any investment, but stocks have held their own versus other asset classes in such scenarios and can be one of the first to rise out of the ashes of an economic downturn.
A hedged equity strategy that provides exposure to a broad index, like the S&P 500, Russell 2000 or EAFE, can help mitigate single stock or sector risk. Then, based on how the hedging is executed, the hedged equity strategy may experience less volatility and overall drawdown risk than the underlying equity index, thereby benefiting the investor through the math behind investment returns.
David Lovell, Managing Director – Head of Marketing, is responsible for Swan’s brand, marketing, content, events, and media. David began his career in the financial industry at Mass Mutual. David currently holds a Series 65 license.
Our portfolio managers and analysts are dedicated to creating relevant, educational Articles, Podcasts, White Papers, Videos, and more.
Swan Global Investments, LLC is a SEC registered Investment Advisor that specializes in managing money using the proprietary Defined Risk Strategy (“DRS”). SEC registration does not denote any special training or qualification conferred by the SEC. Swan offers and manages the DRS for investors including individuals, institutions and other investment advisor firms.
All Swan products utilize the Defined Risk Strategy (“DRS”), but may vary by asset class, regulatory offering type, etc. Accordingly, all Swan DRS product offerings will have different performance results due to offering differences and comparing results among the Swan products and composites may be of limited use. All data used herein; including the statistical information, verification and performance reports are available upon request. The S&P 500 Index is a market cap weighted index of 500 widely held stocks often used as a proxy for the overall U.S. equity market. The Bloomberg US Aggregate Bond Index is a broad-based flagship benchmark that measures the investment grade, US dollar-denominated, fixed-rate taxable bond market. The index includes Treasuries, government-related and corporate securities, MBS (agency fixed-rate and hybrid ARM pass-throughs), ABS and CMBS (agency and non-agency). Indexes are unmanaged and have no fees or expenses. An investment cannot be made directly in an index. Swan’s investments may consist of securities which vary significantly from those in the benchmark indexes listed above and performance calculation methods may not be entirely comparable. Accordingly, comparing results shown to those of such indexes may be of limited use. The adviser’s dependence on its DRS process and judgments about the attractiveness, value and potential appreciation of particular ETFs and options in which the adviser invests or writes may prove to be incorrect and may not produce the desired results. There is no guarantee any investment or the DRS will meet its objectives. All investments involve the risk of potential investment losses as well as the potential for investment gains. Prior performance is not a guarantee of future results and there can be no assurance, and investors should not assume, that future performance will be comparable to past performance. Further information is available upon request by contacting the company directly at 970-382-8901 or www.swanglobalinvestments.com.
265-SGI-090922