This site uses cookies. By continuing to browse the site, you are agreeing to our use of cookies. Privacy Policy
Okay, thanksThis is the final of three blog posts in which we explore the variables that will impact the DRS’s performance during a downturn. Those three primary variables are:
With speed and magnitude already discussed, the final topic on our list is duration.
The duration of a market downturn typically impacts the profitability of the harvesting of option premium trades. Usually during market sell-offs there is a heightened level of market volatility. During these environments, option premium is often described as “rich.” In other words, it’s a seller’s market and the price of options is high for those willing to write them. The DRS prefers that the duration of the sell-off last longer, so that we can execute multiple trades at these rich levels of premium. Conversely, if a sell-off is short-lived and quickly forgotten, we aren’t able to collect as much premium as we would have liked for as long as we would have liked.
It is certainly possible to profitably harvest option premium during periods of low volatility because the primary driver of an income trade is the gap between implied and realized volatility. However, the “sweet spot” for the DRS is moderate levels of volatility, with VIX levels in the mid-teens to low-20s range.

Source: Swan Global Investments; hypothetical representation
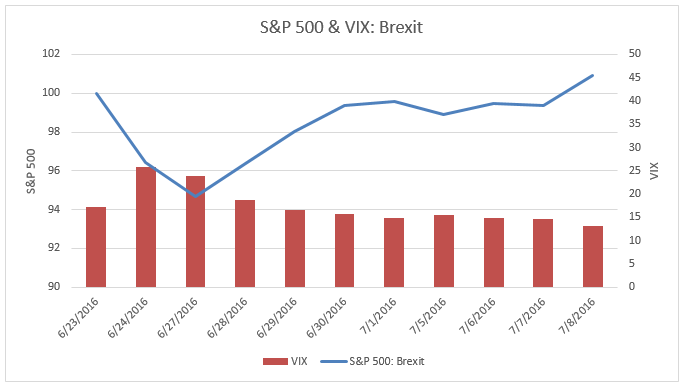
On June 23rd, 2016, voters in the United Kingdom shocked the political establishment by voting in favor of “Brexit”—the departure of Great Britain from the European Union. Markets responded negatively at first, but then quickly rallied. Although the sell-off was worse in European markets, the S&P 500 was down 5.34% over the two trading days of June 24th and 27th. The VIX spiked from 17.25 on June 23rd to 25.76 the following day.
However, markets quickly brushed off its concerns about Brexit. Markets trended back upwards and by July 8th had recovered all of the losses sustained following the Brexit vote. By July 8th the VIX was down to 13.20, lower than where it was before Brexit.
During this short sell-off the DRS did well due to the hedge position, losing less than half of the market over June 24th-27th. However, we would have preferred that the VIX stay at elevated levels in the high-teens or low-20s for the opportunity to execute more trades and collect more premium. Instead, it dropped back to the depressed levels in the low-teens where the VIX spent most of 2016 and 2017.
Source: Morningstar Direct, Bloomberg
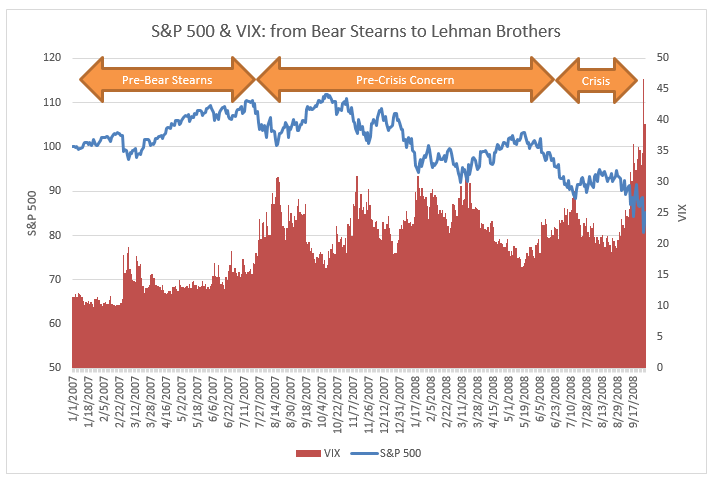
During the first half of 2007, markets were up a healthy amount. By mid-July the S&P 500 was up over 10% and the VIX spent most of the year in the 12-14 range. However, on July 16, 2007, Bear Stearns disclosed that two of their hedge funds that focused on subprime mortgages were all but wiped out.
In the year following Bear Stearns’ revelation, the S&P 500 trended nervously downwards, losing almost 18% of its value. More important to the DRS was the fact that the VIX entered a new trading regime, spending most of its time in the high teens or 20s. As stated previously, this is the “sweet spot” for the DRS, where option premium is both rich and sustained. The DRS did quite well with its harvesting of option premium during this period, the lead-up to the Global Financial Crisis[1].
Source: Morningstar Direct, Bloomberg
In a related note, the start of 2018 bears a striking resemblance to the start of 2007. VIX was at similarly low levels to start the year. However, 2018 has seen numerous concerns rattle the markets—the end of the easy money period, rising inflation, a potential trade war, etc. Will we see the markets shift from a low volatility regime to a mid-volatility regime, which the DRS prefers? Time will tell.
This recent series of blog posts provided an executive summary version of the three primary drivers of DRS performance during downturns. For a more in-depth exploration, please refer to the white paper “Managing Expectations: Drawdown Scenarios and Swan DRS Performance Analysis.” In addition to these three primary factors, the paper discusses various special situations like V-shaped recoveries, extended declines from heightened volatility, whipsaws, and the differences in volatility regimes.
Marc Odo, CFA®, CAIA®, CIPM®, CFP®, Client Portfolio Manager, is responsible for helping clients and prospects gain a detailed understanding of Swan’s Defined Risk Strategy, including how it fits into an overall investment strategy. Formerly, Marc was the Director of Research for 11 years at Zephyr Associates.
[1] Note to Pre-Financial Crisis: During the first half of 2008, the DRS also benefitted from the increase in the volatility premium of its hedge and the fact that the hedges spent most of 2008 in-the-money.
Swan Global Investments, LLC is a SEC registered Investment Advisor that specializes in managing money using the proprietary Defined Risk Strategy (“DRS”). SEC registration does not denote any special training or qualification conferred by the SEC. Swan offers and manages the DRS for investors including individuals, institutions and other investment advisor firms. Any historical numbers, awards and recognitions presented are based on the performance of a (GIPS®) composite, Swan’s DRS Select Composite, which includes non-qualified discretionary accounts invested in since inception, July 1997, and are net of fees and expenses. Swan claims compliance with the Global Investment Performance Standards (GIPS®).
All Swan products utilize the Defined Risk Strategy (“DRS”), but may vary by asset class, regulatory offering type, etc. Accordingly, all Swan DRS product offerings will have different performance results due to offering differences and comparing results among the Swan products and composites may be of limited use. All data used herein; including the statistical information, verification and performance reports are available upon request. The S&P 500 Index is a market cap weighted index of 500 widely held stocks often used as a proxy for the overall U.S. equity market. Indexes are unmanaged and have no fees or expenses. An investment cannot be made directly in an index. Swan’s investments may consist of securities which vary significantly from those in the benchmark indexes listed above and performance calculation methods may not be entirely comparable. Accordingly, comparing results shown to those of such indexes may be of limited use. The adviser’s dependence on its DRS process and judgments about the attractiveness, value and potential appreciation of particular ETFs and options in which the adviser invests or writes may prove to be incorrect and may not produce the desired results. There is no guarantee any investment or the DRS will meet its objectives. All investments involve the risk of potential investment losses as well as the potential for investment gains. Prior performance is not a guarantee of future results and there can be no assurance, and investors should not assume, that future performance will be comparable to past performance. All investment strategies have the potential for profit or loss. Further information is available upon request by contacting the company directly at 970-382-8901 or www.www.swanglobalinvestments.com. 366-SGI-092018