This site uses cookies. By continuing to browse the site, you are agreeing to our use of cookies. Privacy Policy
Okay, thanksIn this, the second of three blog posts, we discuss the different variables that will impact the Defined Risk Strategy’s performance during a downturn. There are three primary variables that we use to differentiate the downturns. They are:
In a previous blog post we discussed the speed of the sell-off. This post discusses the magnitude of the sell-off.
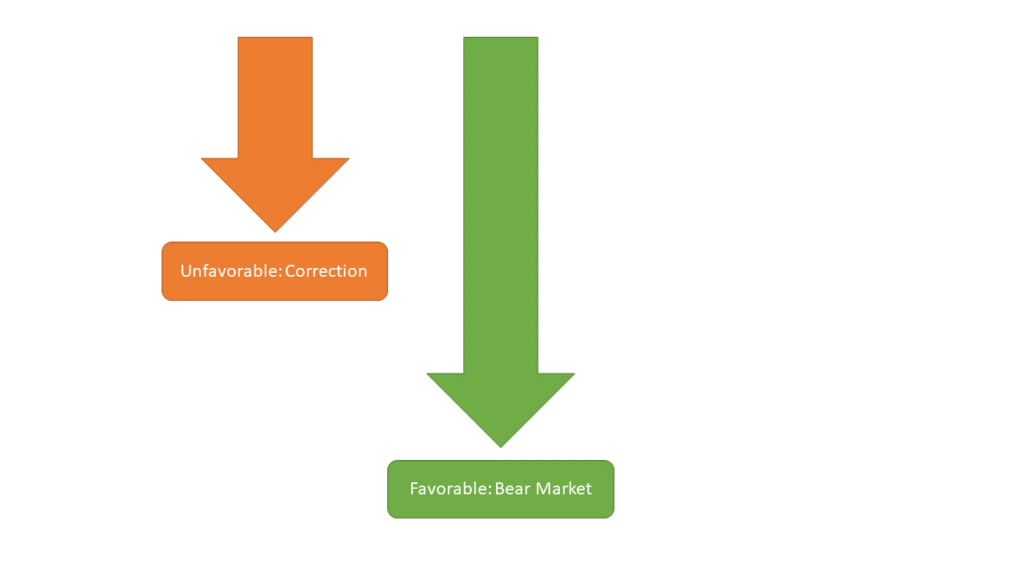
Swan has always maintained that the Defined Risk Strategy was built to protect against bear markets, not corrections. Bear markets are commonly defined as sell-offs of 20% or more and take months if not years from which to recover. Alternatively, corrections are sell-offs of 10% to 19%, might last a few weeks or at most a couple months. Bear markets are life-changing whereas corrections are quickly forgotten.
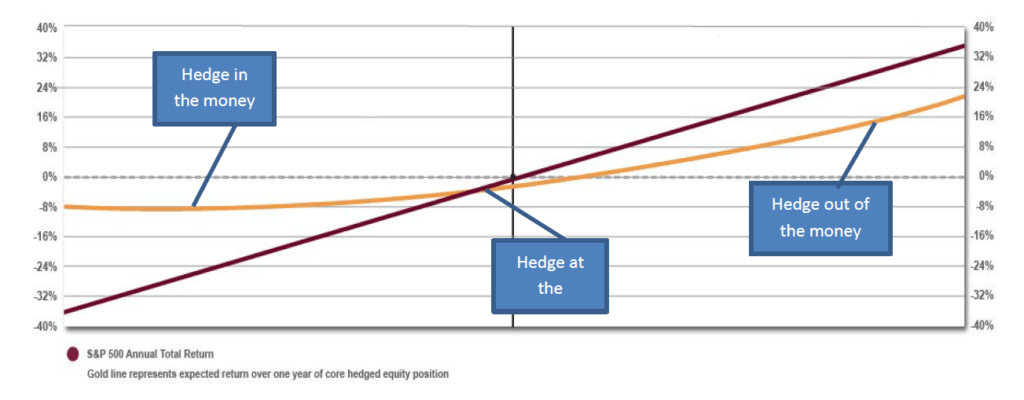
The magnitude of a market downturn primarily impacts the value of the hedging component of the DRS. The more the market moves down, the more valuable the hedges become. Furthermore, the value of the put options accelerates as they go deep-in-the-money. The larger the magnitude of the sell-off, the better the performance of the DRS’s hedge.
Source: Swan Global Investments; hypothetical representation
This relationship is displayed in the graph below. If the hedge is out-of-the-money, the DRS will likely move more in-line with the market. This is true for both upwards and downwards moves at this point in the curve. If the hedge is at- or near-the-money, it will be partially sensitive to market moves. However, if the hedge is deep in-the-money, losses in the market are offset dollar-for-dollar by increases in the value of the hedge.
Source: Swan Global Investments; hypothetical representation
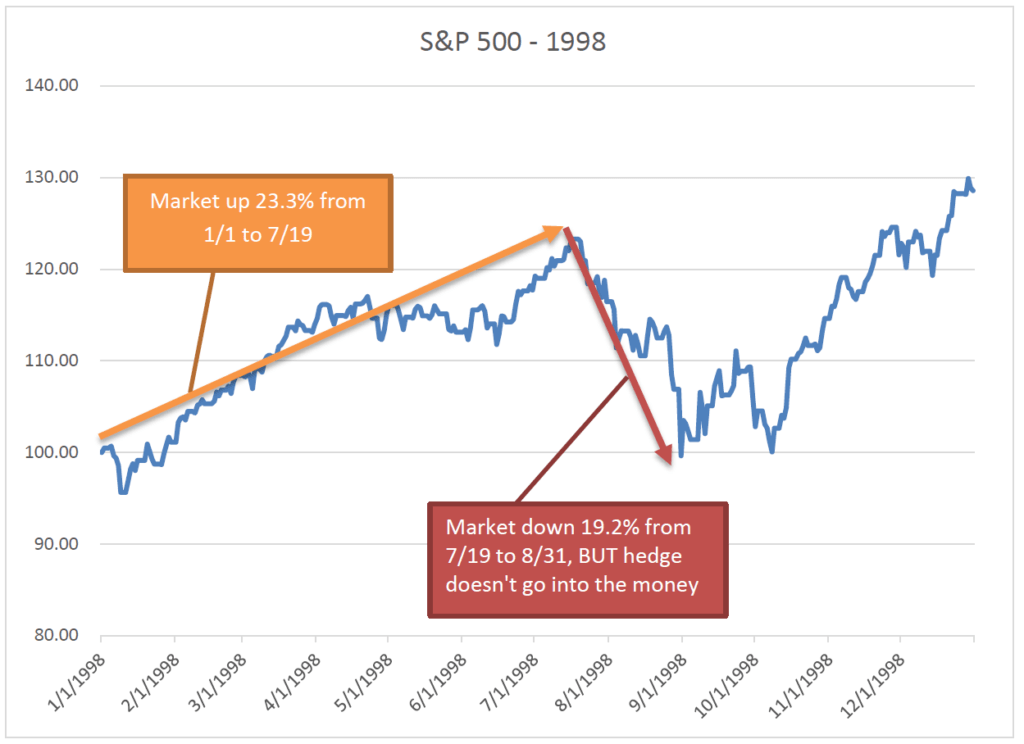
During the summer of 1998 the Russian default triggered a crisis at the hedge fund Long Term Capital Management. The market had been up 23.3% up until that point. During the crisis, the peak-to-trough losses were 19.2% on the S&P 500. While certainly a major correction, the LTCM crisis technically just missed the 20% breakpoint to be called a true bear market. In addition, the market also quickly recovered to new highs.
The bigger impact on the DRS, however, was due to the fact that the hedge did not go in-the-money. Essentially, the LTCM crisis had erased all of 1998’s gains up until that point; by the time the market bottomed out, the market was more or less where it started the year. On the way down, the hedge did not offer a lot of protection since it was so far out-of-the-money. The hedge was near-the-money when the market bottomed, and its value would have accelerated had the market continued to drop. Instead, the market reversed itself and all of the losses associated with LTCM had been recovered by November 23rd, 1998.
[1]
Source: Morningstar Direct, Bloomberg
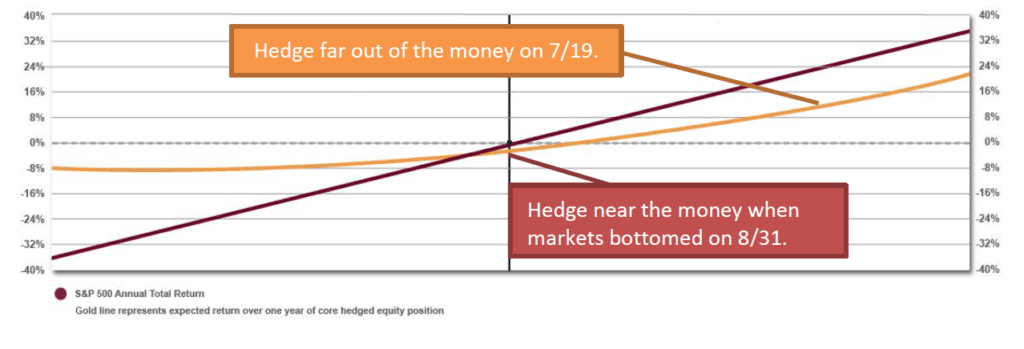
Returning to our most useful charts, we can see where the DRS was prior to and after the LTCM Crisis.
 Source: Swan Global Investments; hypothetical representation
Although markets had been trending downward throughout 2008, they plummeted in the last four months of the year. The S&P 500 was at 1,468 at the start of 2008 but fell to 1,193 after Lehman failed on September 15th. The S&P 500 ended 2008 at 903 but didn’t bottom until March 9th, 2009 at 677. The magnitude of the sell-off in the markets was so great we were able to execute not one but two rehedges. Twice, our put options went quite deep in-the-money and really proved their value to the portfolio. The DRS was able to sell those put options at a healthy profit and re-invest in the market as the market was trading at a low point[2].

Source: Morningstar Direct, Bloomberg
Below we see the Global Financial Crisis play out on the target return band. This process occurred twice during the crisis, setting up the DRS to perform quite well when markets rebounded in 2009.

Source: Swan Global Investments; hypothetical representation
In the third and final blog post in this series we discuss the final factor, the duration of the drawdown.

Marc Odo, CFA®, CAIA®, CIPM®, CFP®, Client Portfolio Manager, is responsible for helping clients and prospects gain a detailed understanding of Swan’s Defined Risk Strategy, including how it fits into an overall investment strategy. Formerly, Marc was the Director of Research for 11 years at Zephyr Associates.
[1] Notes to August 1998: during the LTCM crisis, the harvesting of option premium trades also suffered. In this highly volatile environment, markets whipsawed up and down, a difficult scenario for market-neutral trades.
[2] Note to Global Financial Crisis: In addition, our option premium trades were able to generate sizable returns.
Swan Global Investments, LLC is a SEC registered Investment Advisor that specializes in managing money using the proprietary Defined Risk Strategy (“DRS”). SEC registration does not denote any special training or qualification conferred by the SEC. Swan offers and manages the DRS for investors including individuals, institutions and other investment advisor firms. Any historical numbers, awards and recognitions presented are based on the performance of a (GIPS®) composite, Swan’s DRS Select Composite, which includes non-qualified discretionary accounts invested in since inception, July 1997, and are net of fees and expenses. Swan claims compliance with the Global Investment Performance Standards (GIPS®).
All Swan products utilize the Defined Risk Strategy (“DRS”), but may vary by asset class, regulatory offering type, etc. Accordingly, all Swan DRS product offerings will have different performance results due to offering differences and comparing results among the Swan products and composites may be of limited use. All data used herein; including the statistical information, verification and performance reports are available upon request. The S&P 500 Index is a market cap weighted index of 500 widely held stocks often used as a proxy for the overall U.S. equity market. Indexes are unmanaged and have no fees or expenses. An investment cannot be made directly in an index. Swan’s investments may consist of securities which vary significantly from those in the benchmark indexes listed above and performance calculation methods may not be entirely comparable. Accordingly, comparing results shown to those of such indexes may be of limited use. The adviser’s dependence on its DRS process and judgments about the attractiveness, value and potential appreciation of particular ETFs and options in which the adviser invests or writes may prove to be incorrect and may not produce the desired results. There is no guarantee any investment or the DRS will meet its objectives. All investments involve the risk of potential investment losses as well as the potential for investment gains. Prior performance is not a guarantee of future results and there can be no assurance, and investors should not assume, that future performance will be comparable to past performance. All investment strategies have the potential for profit or loss. Further information is available upon request by contacting the company directly at 970-382-8901 or www.www.swanglobalinvestments.com. 348-SGI-082218