Sep. 1, 2021
Insight Series – Comparing Hedging and Options Strategies
A long/short investing strategy is constructed by initiating a long (buy/hold) position in one or more securities that is expected to appreciate over a specified time while simultaneously initiating a short position in one or more securities that are expected to decline in value over a specified time. The objective is to seek to minimize market exposure while profiting from gains in the long positions, along with price declines in the short positions.
In most circumstances, the drivers of returns in a long/short strategy will be at the individual stock level. The whole value proposition of long/short strategies is that a portfolio manager should be unconstrained and profit not only from investing in stocks he likes but also profit from shorting stocks he dislikes. Whether or not the portfolio manager is any good at identifying those individual winners and losers, as well as the timing of those investment positions taken, will ultimately determine the success or failure of such a strategy.
That said, it is common for long/short strategies to have certain biases reflected in their portfolio. These biases might involve valuations, sectors, capitalization, or any other type of quantifiable factors. For example, if a portfolio manager is fundamentally a value investor, one would likely see value names held long and growth stocks shorted. This kind of portfolio would be doubly exposed to its factor bets, which is great if the factor is in favor but potentially disastrous if it is out of favor.
As any sophisticated analyst knows, return and risk are two sides of the same coin: if the returns of a long/short fund are driven by the portfolio manager’s stock picks, so will be the risks. The portfolio manager will live or die on their ability to identify in advance the individual winners and losers.
If the portfolio reflects a certain factor bias, that bias could help or hurt depending on whether or not it is in favor. To return to our previous example, imagine a portfolio manager has a value bias. A long-only value portfolio will trail the market in a year when growth is in favor, like 2017 or 2015. However, the long/short value manager who is long value stocks and short growth stocks would be doubly exposed to such a factor bet.
Because portfolio managers are unconstrained in a long/short strategy and can essentially double their bets, the performance across long/short funds varies widely. The dispersion between “first and worst” can be quite wide. It is dangerous to use “the average long/short” fund as a proxy for the asset class when the returns and risks are so divergent.
The table below illustrates this:
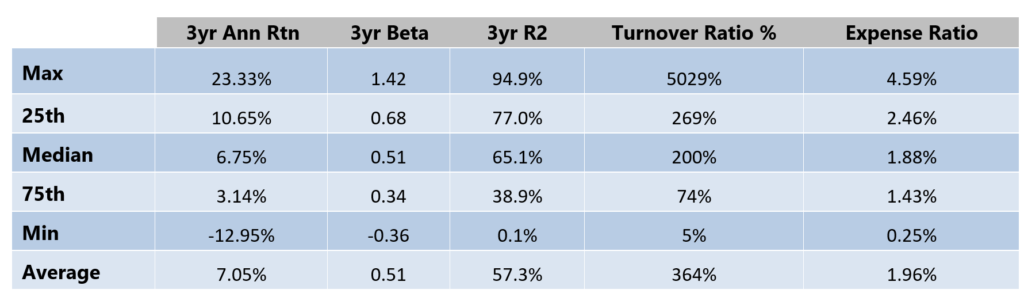 Source: Morningstar Direct, Zephyr StyleADVISOR. Annualized return, beta, and R2 were calculated vs. the S&P 500 and only for those 187 funds with a three-year track record as of 6/30/21.
While the dispersion in performance is wide, long/short managers do tend to share certain tendencies. Long/short managers tend to have higher than average expense ratios and trade more frequently. According to Morningstar, the median long/short manager has an annual turnover ratio of 163%, and the most active fund has an eye-watering turnover ratio of 7,042%. It is fair to say an investor must have a lot of faith in that particular manager’s process in order to justify a turnover ratio of 7,042%.
It is often said that alternatives perform one of two roles within a portfolio: they are either “alpha drivers” or “beta reducers.” Depending on the individual long/short manager, they can fill either role.
In the previous table, we saw how the sensitivity to the market, as measured by beta and R-squared, varies widely from fund to fund. These numbers should help an analyst or investor determine which role an individual long/short manager might play within a portfolio.
Compared to the typical long/short manager, the Defined Risk Strategy (DRS) approaches the market from the opposite end of the spectrum. While the overall goal is roughly the same—to produce respectable absolute returns through bull and bear markets—the way they seek to accomplish that goal is completely different. One of the fundamental precepts of the DRS is that it is difficult, if not impossible, to identify those stocks that will outperform or underperform on a consistent basis. In contrast, a long/short fund’s entire value proposition is based upon investing long outperforming stocks and shorting underperforming stocks.
The DRS seeks broad market exposure, utilizing broad and liquid ETFs to gain robust coverage of an asset class. Risk is managed utilizing broad-based options on those same asset classes. The DRS’s primary drivers of returns are its buy-and-hold market exposure, its hedging, and its premium collection. All three of these components are at an asset class level and are designed to provide value in different types of markets (i.e. rising, falling, or flat, respectively). The DRS can be described as a “top-down” manager whereas a long/short approach is the epitome of a “bottom-up” style.
Because the value propositions of a typical long/short manager and the DRS are so fundamentally different, a case could be made for pairing the two together. The two strategies approach investing in such different ways that they could form a complementary partnership. Specifically, a long/short fund with more upside market capture and higher beta could be a nice potential candidate for pairing with the DRS, since the DRS has traditionally been used in a risk-reducing role. This would be an example of combining an “alpha driver” with a “beta reducer.”
Our portfolio managers and analysts are dedicated to creating relevant, educational Articles, Podcasts, White Papers, Videos, and more.
Marc Odo, CFA®, FRM®,CAIA®, CIPM®, CFP®, Client Portfolio Manager, is responsible for helping clients and prospects gain a detailed understanding of Swan’s Defined Risk Strategy, including how it fits into an overall investment strategy. Formerly Marc was the Director of Research for 11 years at Zephyr Associates.
Swan Global Investments, LLC is a SEC registered Investment Advisor that specializes in managing money using the proprietary Defined Risk Strategy (“DRS”). SEC registration does not denote any special training or qualification conferred by the SEC. Swan Global Investments offers and manages the Defined Risk Strategy for investors including individuals, institutions and other investment advisor firms. All Swan products utilize the Swan DRS but may vary by asset class, regulatory offering type, etc. Accordingly, all Swan DRS product offerings will have different performance results and comparing results among the Swan products and composites may be of limited use. Indices are unmanaged and cannot be invested into directly. Past performance is no guarantee of future results. DRS results are from the Select Composite, net of fees, as of 12/31/2016. The charts and graphs contained herein should not serve as the sole determining factor for making investment decisions. Hypothetical performance analysis is not actual performance history. Actual results may materially vary and differ significantly from the suggested hypothetical analysis performance data. This analysis is not a guarantee or indication of future performance. Swan claims compliance with the Global Investment Performance Standards (GIPS®). Any historical numbers, awards and recognitions presented are based on the performance of a (GIPS®) composite, Swan’s DRS Select Composite, which includes nonqualified discretionary accounts invested in since inception, July 1997 and are net of fees and expenses. All data used herein; including the statistical information, verification and performance reports are available upon request.
The benchmarks used for the DRS Select Composite are the S&P 500 Index, which consists of approximately 500 large cap stocks often used as a proxy for the overall U.S. equity market, and a 60/40 blended composite, weighted 60% in the aforementioned S&P 500 Index and 40% in the Barclays US Aggregate Bond Index. The 60/40 is rebalanced monthly. The Barclays US Aggregate Bond Index is a broad-based flagship benchmark that measures the investment grade, US dollar-denominated, fixed-rate taxable bond market. The index includes Treasuries, government-related and corporate securities, MBS (agency fixed-rate and hybrid ARM pass-throughs), ABS and CMBS (agency and non-agency). Indexes are unmanaged and have no fees or expenses. An investment cannot be made directly in an index. Swan’s investments may consist of securities which vary significantly from those in the benchmark indexes listed above and performance calculation methods may not be entirely comparable. Accordingly, comparing results shown to those of such indexes may be of limited use.
The advisor’s dependence on its DRS process and judgments about the attractiveness, value and potential appreciation of particular ETFs and options in which the advisor invests or writes may prove to be incorrect and may not produce the desired results. There is no guarantee any investment or the DRS will meet its objectives. All investments involve the risk of potential investment losses as well as the potential for investment gains. Prior performance is not a guarantee of future results and there can be no assurance, and investors should not assume, that future performance will be comparable to past performance. Further information is available upon request by contacting the company directly at 970.382.8901 or visit www.swanglobalinvestments.com. 108-SGI-030118