VIX Strategies – Easy as It Sounds?
As part of an ongoing series trying to make sense of the broad, catch-all category called “liquid alternatives,” this post will explore one of the newest and most esoteric alternative strategies: volatility.
As has been the case in this series, we will discuss:
For most of 2017, volatility has been very subdued. The most frequently cited measure of volatility, the VIX, has been at levels not seen in a decade. The shrewd investor might try to capitalize on anticipated increases of market volatility by investing in one of the new volatility-based exchange-traded products (ETP). There are over two dozen ETPs or mutual funds in the Morningstar database that attempt to capitalize on volatility in some shape or form, up from zero in 2009. This category includes long volatility and short volatility strategies, leveraged and unleveraged, ETNs and ETFs, and as of 8/21/2017 has an aggregate AUM exceeding $4.6 billion. They are used as hedging vehicles as well as speculative plays.
While betting on volatility might seem like a bright idea, it is much easier said than done. The unfortunate reality is the long-term performance of volatility-based ETPs has been atrocious. The average year-to-date return in the volatility category, through August 21st, 2017 has been -16.40%. Over the last three calendar years, the averages have been -23.68% (2016), -26.38% (2015) and -21.25% (2014).
Why is this?

Source: Morningstar Direct
A lot of the problem stems from the fact that most of these products are based on VIX futures, or futures on the CBOE Volatility Index. But just what exactly is the VIX? A lot of people commonly refer to the VIX as the “fear gauge” but that description leaves a lot to be desired.
What is VIX actually measuring? How is it calculated?
When you get down to it, the VIX is calculated by inferring the implied volatility of the S&P 500, using the prices of a basket of short-term puts and calls on the S&P 500 as an indicator of market expectations for future volatility. While from an academic standpoint there is some logic to inferring future volatility from option prices, what the VIX actually measures are the supply and demand of short-term options.
Also, from a practical standpoint, the VIX is not an investable index. Unlike a standard stock index where one can simply purchase and hold the stocks in the proper weights, no one has yet devised a way to directly buy the VIX.
Instead, most products that try to capture the VIX movements do so via the use of short-term futures. Futures are of course another type of derivative, so a future on the VIX is really a derivative of a derivative. Futures have their own unique pricing complexities. In the case of VIX futures, the futures almost always trade at a premium to the VIX, a situation known in the futures market as “contango.” The term structure of futures resembles the yield curve, where typically the longer-dated securities are worth more than short-term securities.
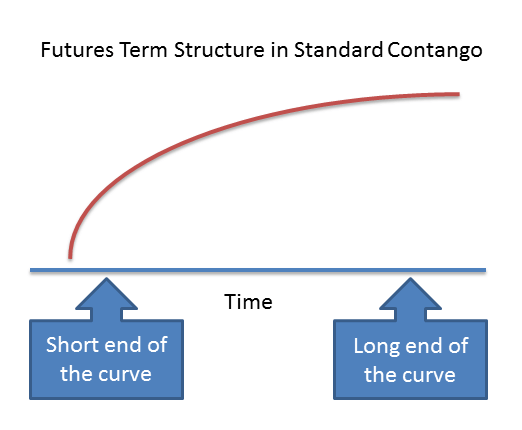
Source: Swan Global Investments
Because these are short-term contracts, a VIX futures strategy must constantly be buying futures that are almost always more expensive today than they will be in the future. As the futures contract gets closer to delivery date they lose value, sliding down the curve. In order to maintain exposure in futures, this process is repeated again and again. In practical terms, this means consistently maintaining a position in VIX futures will almost always lose money.
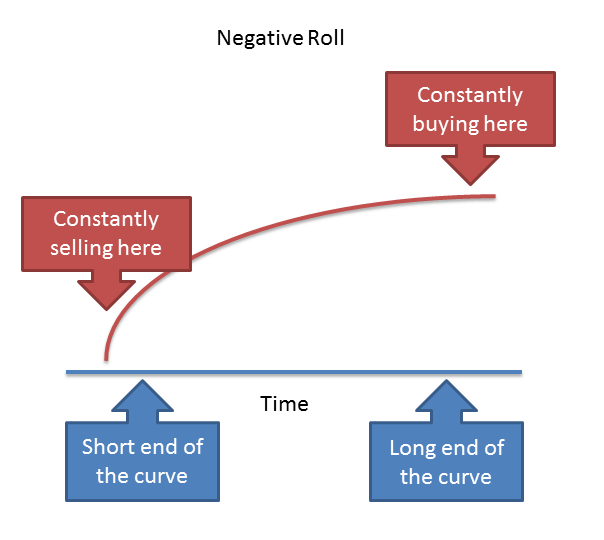
Source: Swan Global Investments
In addition, most volatility ETPs are passively managed. This is tricky when volatility conditions change extremely fast. Anyone who has kept an eye on daily movements in the VIX or related ETPs knows that double-digit daily moves are not uncommon. Yet many volatility ETPs are methodically managed in a passive fashion and are not designed to react to changing market conditions.
Finally, the very fact that the prices of volatility ETPs are so volatile themselves makes them inappropriate as a long-term investment vehicle and impractical as a hedging vehicle. As discussed in a previous blog post, variance drain deteriorates the long-term value of any investment.
Generally speaking, the more volatile an asset and the longer the holding period, the more variance drain will diminish its value. Since volatility ETPs are so volatile, the impact of variance drain is especially pronounced.
If one intends to use volatility ETPs to profit from volatility, the time horizon must be very short—not much longer than a few days or weeks, in most cases. In other words, volatility ETPs are better suited for speculative purposes. The factors discussed—contango, passive management, and variance drain—make volatility ETPs a poor choice for hedging or long-term investing.
At this point, an astute investor may wonder, “If long volatility strategies have lost so much money so consistently, then why shouldn’t we flip the script? Wouldn’t a short volatility strategy mint money?”
There are short volatility ETPs available, and yes, their performance of late has been eye-popping. The fact that realized volatility has been less than implied volatility is the ideal situation for a short vol strategy. The contango phenomenon works for, not against, a short strategy.
That said, the other concerns regarding volatility plays remain true for short strategies. Short strategies are also very volatile and can lose a lot of money quickly. They are usually passively managed, so losing positions can snowball quickly, wiping out months of gains. Variance drain is very much a concern in a highly volatile product, and the impact of variance drain will be multiplied in a leveraged product. The graph below shows the price movements on the SVXY, a short volatility product.

Source: Morningstar Direct, Swan Global Investments
During the August 2015 correction, the SVXY lost over half its value in ten trading days. A short while later, the ETF again lost almost half its value between December 1st, 2015 and February 11th, 2016.
If one wishes to potentially harvest the so-called volatility premium over longer time horizons, it is the opinion of Swan Global Investments that you need to do so directly. If you want to seek profit from the fear and volatility that is priced into current options, you typically must trade the options themselves.
Also, given how quickly things change in the options market, it is essential to have active management and strict risk controls in place to mitigate and manage the risk of a volatility capture strategy. This approach to premium harvesting is one of the components of Swan’s flagship hedged equity approach, the Defined Risk Strategy (Swan DRS).
For 20 years the Swan DRS has systematically attempted to collect the volatility premium by selling out of the money calls and puts on the S&P 500. The Swan DRS combines volatility capture, long exposure to the market via ETFs, and hedging techniques in a single strategy seeking to provide consistent returns throughout rising, declining, or flat markets.
For more about how the Swan DRS compares with other strategies, check out previous posts in our “Strategy Comparison Series”:
Marc Odo, CFA®, CAIA®, CIPM®, CFP®, Client Portfolio Manager, is responsible for helping clients and prospects gain a detailed understanding of Swan’s Defined Risk Strategy, including how it fits into an overall investment strategy. Formerly Marc was the Director of Research for 11 years at Zephyr Associates.
Swan Global Investments, LLC is a SEC registered Investment Advisor that specializes in managing money using the proprietary Defined Risk Strategy (“DRS”). SEC registration does not denote any special training or qualification conferred by the SEC. Swan Global Investments offers and manages the Defined Risk Strategy for investors including individuals, institutions and other investment advisor firms. All Swan products utilize the Swan DRS but may vary by asset class, regulatory offering type, etc. Accordingly, all Swan DRS product offerings will have different performance results and comparing results among the Swan products and composites may be of limited use. Indices are unmanaged and cannot be invested into directly. Past performance is no guarantee of future results. DRS results are from the Select Composite, net of fees, as of 12/31/2016. The charts and graphs contained herein should not serve as the sole determining factor for making investment decisions. Hypothetical performance analysis is not actual performance history. Actual results may materially vary and differ significantly from the suggested hypothetical analysis performance data. This analysis is not a guarantee or indication of future performance. Swan claims compliance with the Global Investment Performance Standards (GIPS®). Any historical numbers, awards and recognitions presented are based on the performance of a (GIPS®) composite, Swan’s DRS Select Composite, which includes nonqualified discretionary accounts invested in since inception, July 1997 and are net of fees and expenses. All data used herein; including the statistical information, verification and performance reports are available upon request.
The benchmarks used for the DRS Select Composite are the S&P 500 Index, which consists of approximately 500 large cap stocks often used as a proxy for the overall U.S. equity market, and a 60/40 blended composite, weighted 60% in the aforementioned S&P 500 Index and 40% in the Barclays US Aggregate Bond Index. The 60/40 is rebalanced monthly. The Barclays US Aggregate Bond Index is a broad-based flagship benchmark that measures the investment grade, US dollar-denominated, fixed-rate taxable bond market. The index includes Treasuries, government-related and corporate securities, MBS (agency fixed-rate and hybrid ARM pass-throughs), ABS and CMBS (agency and non-agency). Indexes are unmanaged and have no fees or expenses. An investment cannot be made directly in an index. Swan’s investments may consist of securities which vary significantly from those in the benchmark indexes listed above and performance calculation methods may not be entirely comparable. Accordingly, comparing results shown to those of such indexes may be of limited use.
The advisor’s dependence on its DRS process and judgments about the attractiveness, value and potential appreciation of particular ETFs and options in which the advisor invests or writes may prove to be incorrect and may not produce the desired results. There is no guarantee any investment or the DRS will meet its objectives. All investments involve the risk of potential investment losses as well as the potential for investment gains. Prior performance is not a guarantee of future results and there can be no assurance, and investors should not assume, that future performance will be comparable to past performance. Further information is available upon request by contacting the company directly at 970.382.8901 or visit www.swanglobalinvestments.com. 222-SGI-083017