One of the more esoteric challenges facing today’s investors and financial advisors is to keep up with the rapid evolution of the products and solutions available. Some innovations, like exchange-traded funds, are game-changers and have gathered trillions in assets. Others turn out to be nothing more than fads (anyone remember the hype surrounding 130/30 funds?).
Until new investment strategies become more established, the easy way out is to lump them all together in the loosely defined category “liquid alternatives.” Since the Financial Crisis of 2007-09, there has been an explosion of strategies labeled “different.”
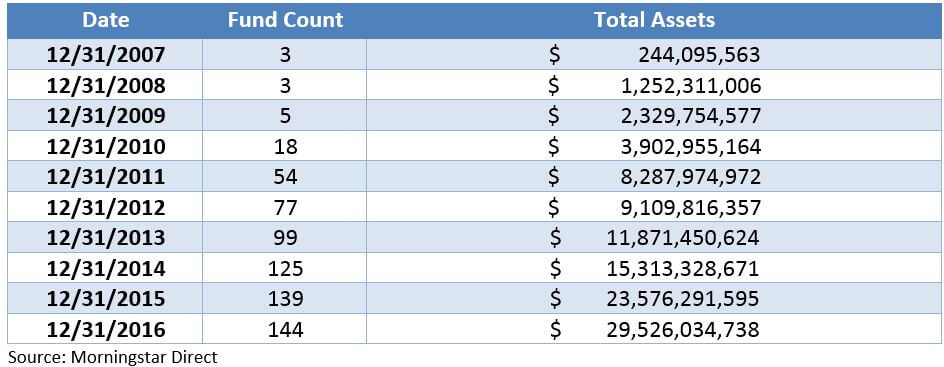
One of the hottest categories in the loosely defined liquid alternative space is managed futures. According to Morningstar, there are currently 144 mutual funds with an aggregate $29.5bn dollars in this category, a significant increase from five, or even three years ago.

Swan has been publishing a Strategy Comparison blog series (see links below) on the pros and cons of different liquid alternative strategies . We will discuss:
When it comes to managed futures, returns are generated in the derivatives market. In fact, many managed futures funds have the majority of their holdings in nothing more than short-term cash positions, used to collateralize their futures positions. The futures themselves can be across a wide variety of underlying assets. Futures-based investing started with commodity futures, given the difficulty of investing in physical commodities. As managed futures strategies have become more popular, some have focused upon equity and fixed income futures. Some strategies cover both capital and physical markets.
Most managed futures strategies are momentum-based or trend-following. In other words, recent short-term direction dictates future short-term positioning. Obviously, not all managed futures are this way, but trend-following tends to be a common trait. The official Morningstar description of the Managed Futures Category is:
“Managed Futures: These funds primarily trade liquid global futures, options, swaps, and foreign exchange contracts, both listed and over-the-counter. A majority of these funds follow trend-following, price-momentum strategies. Other strategies included in this category are systematic mean reversion, discretionary global macro strategies, commodity index tracking, and other futures strategies. More than 60% of the fund’s exposure is invested through derivative securities. These funds obtain exposure primarily through derivatives; the holdings are largely cash instruments.”
Source: Morningstar Direct
Any market-timing strategy’s success depends upon being one step ahead of the game. The old saying “the trend is your friend” sums up momentum strategies well. The shortcomings of such an approach, however, is that a strategy has to be smart enough to recognize a trend and participate in it as it is running, but also nimble enough to abandon the trend before it reverses or just after. This is easier said than done. While significant profits can be generated if the model is working, a reversal can just as easily erase any or all gains.
Also, the fact that some managed futures funds call themselves “hedged” is a bit misleading. Most managed futures strategies aren’t hedging anything – they are making a directional bet on the performance of an asset class. It is true that in the past, many managed futures strategies have had low correlations to traditional asset classes. Added to a portfolio, an uncorrelated asset can lower overall volatility. However, that type of result would be better described as diversification rather than a hedge.
Complicating matters is the fact that most of the liquid managed futures strategies were not available during the last major market meltdown. According to the previous table, only three funds were around during the financial crisis of 2007-09. How these funds will perform during a major market sell-off has yet to be seen.
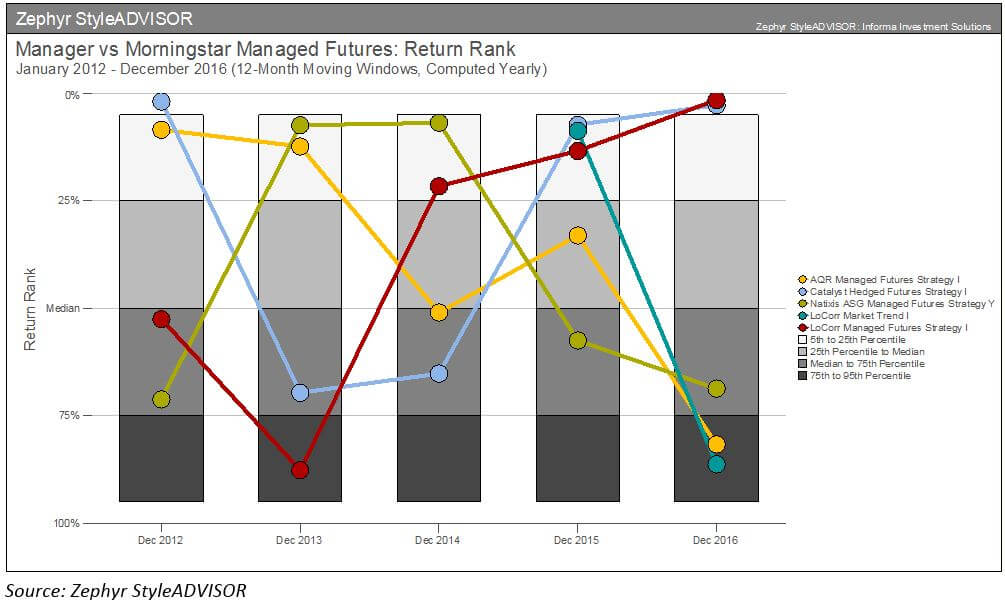
Finally, the performance of individual managed futures funds on a year-to-year basis is fairly erratic. The graph below shows where the five largest managed futures funds in terms of assets plots relative to their peer group. There isn’t a lot of consistency.

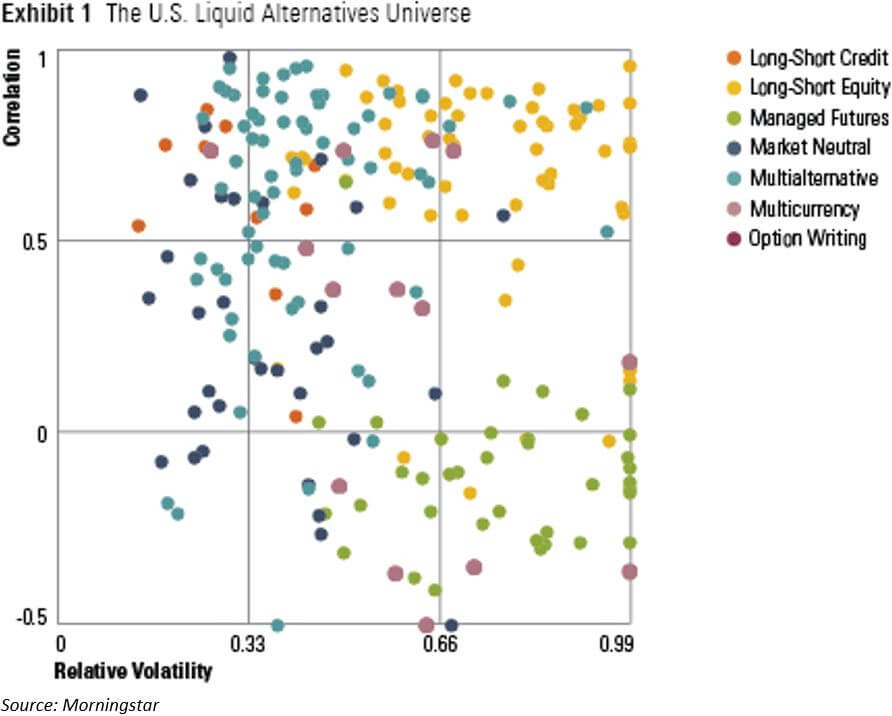
Broadly speaking, people use alternatives for two purposes – either risk reducers or return enhancers. Most managed futures tend to fall into the latter category, those of return enhancers or alpha drivers. Of course, this comes at a cost. Managed futures tend to be more volatile than other options. In fact, in the context of Morningstar’s new alternative style box, managed futures mostly fall on the high side of relative volatility (green dots below):

At this point it should be clear that the typical managed futures strategy is quite different than the Swan DRS approach. The majority of the DRS’s holdings are long, buy-and-hold ETF positions. Long-term puts are purchased to protect against sell-offs in the ETFs. This “always invested, always hedged” position is established because Swan does not believe that market-timing is a viable, long-term solution. Managed futures are the polar opposite, typically holding the majority of their assets in cash and seeking to outmaneuver the market based upon their short-term predictive models.
That said, because the DRS and the typical managed futures strategy are so profoundly different, one might consider mixing the two together to complement each other. The DRS acts as a risk-reducer, a beta-dampener on the portfolio, whereas an uncorrelated managed futures strategy could be used as more of an alpha-driver and diversifier. Of course, implementation depends upon the individual managed future strategy in question and a client’s specific situation, but fundamentally the whole point of mixing and matching managers is bringing together a diverse set of value propositions and skill sets.
For more about how the Swan DRS compares and contrasts with other strategies, check out previous posts in our Strategy Comparison Series:
Looking for a deeper dive into portfolio strategies, check out our recently updated white paper on Optimizing Asset Allocation.
Marc Odo, CFA®, CAIA®, CIPM®, CFP®, Client Portfolio Manager, is responsible for helping clients and prospects gain a detailed understanding of Swan’s Defined Risk Strategy, including how it fits into an overall investment strategy. Formerly Marc was the Director of Research for 11 years at Zephyr Associates.
Swan Global Investments, LLC is a SEC registered Investment Advisor that specializes in managing money using the proprietary Defined Risk Strategy (“DRS”). SEC registration does not denote any special training or qualification conferred by the SEC. Swan Global Investments offers and manages the Defined Risk Strategy for investors including individuals, institutions and other investment advisor firms. All Swan products utilize the Swan DRS but may vary by asset class, regulatory offering type, etc. Accordingly, all Swan DRS product offerings will have different performance results and comparing results among the Swan products and composites may be of limited use. Indices are unmanaged and cannot be invested into directly. Past performance is no guarantee of future results. DRS results are from the Select Composite, net of fees, as of 12/31/2016. The charts and graphs contained herein should not serve as the sole determining factor for making investment decisions. Hypothetical performance analysis is not actual performance history. Actual results may materially vary and differ significantly from the suggested hypothetical analysis performance data. This analysis is not a guarantee or indication of future performance. Swan claims compliance with the Global Investment Performance Standards (GIPS®). Any historical numbers, awards and recognitions presented are based on the performance of a (GIPS®) composite, Swan’s DRS Select Composite, which includes nonqualified discretionary accounts invested in since inception, July 1997 and are net of fees and expenses. All data used herein; including the statistical information, verification and performance reports are available upon request.
The benchmarks used for the DRS Select Composite are the S&P 500 Index, which consists of approximately 500 large cap stocks often used as a proxy for the overall U.S. equity market, and a 60/40 blended composite, weighted 60% in the aforementioned S&P 500 Index and 40% in the Barclays US Aggregate Bond Index. The 60/40 is rebalanced monthly. The Barclays US Aggregate Bond Index is a broad-based flagship benchmark that measures the investment grade, US dollar-denominated, fixed-rate taxable bond market. The index includes Treasuries, government-related and corporate securities, MBS (agency fixed-rate and hybrid ARM pass-throughs), ABS and CMBS (agency and non-agency). Indexes are unmanaged and have no fees or expenses. An investment cannot be made directly in an index. Swan’s investments may consist of securities which vary significantly from those in the benchmark indexes listed above and performance calculation methods may not be entirely comparable. Accordingly, comparing results shown to those of such indexes may be of limited use.
The advisor’s dependence on its DRS process and judgments about the attractiveness, value and potential appreciation of particular ETFs and options in which the advisor invests or writes may prove to be incorrect and may not produce the desired results. There is no guarantee any investment or the DRS will meet its objectives. All investments involve the risk of potential investment losses as well as the potential for investment gains. Prior performance is not a guarantee of future results and there can be no assurance, and investors should not assume, that future performance will be comparable to past performance. Further information is available upon request by contacting the company directly at 970.382.8901 or visit www.swanglobalinvestments.com. 081-SGI-041217