Historically, investors quantified risk in terms of standard deviation, more commonly referred to as volatility. Standard deviation is the most widely used measure of risk in the investing world. The omnipresent Sharpe ratio, which quantifies the risk-vs.-return trade-off, uses standard deviation as its measure of risk.
Using volatility as the sole definition of risk, however, holds a number of flaws and can often be misleading and at odds with investors’ understanding of risk. If capital preservation is the primary concern of an investor, other metrics, like the pain index, provide a better measure of risk than standard deviation.
1. Investors don’t think of risk in terms of standard deviation.
Most investors think of risk in terms of capital preservation—how much money they could potentially lose.
It’s unlikely that many financial advisors field calls from angry clients asking, “What was my volatility last month?” It’s more likely most angry calls are phrased, “How much money did I lose?”
2. It fails to distinguish between upside and downside risk.
By definition, standard deviation measures the volatility of individual returns around a mean return. Unfortunately, standard deviation makes no distinction between the “good” observations that fall above the mean and the “bad” returns that fall below the mean. Most investors would not punish a manager with a high standard deviation if a good portion of the volatility was upside volatility.
3. The observations are viewed as independent when they clearly are not.
The more significant failing of standard deviation is that it does not account for the timing of the negative returns.
If, for example, a decade has half a dozen exceptionally bad months, standard deviation cannot differentiate whether or not these bad observations were randomly scattered throughout the decade or if they were all concentrated within a narrow time frame.
Should the investor care about this flaw in standard deviation? Yes.
Between 1989 and 2013, seven of the worst months in the entire 25 year range of the S&P 500 happened within July 2007 and February 2009—less than two year timeframe. A further twelve of the worst months of the last 25 years occurred during the dot-com bubble and the subsequent bear market at the start of the new millennium.
Logically, this makes sense. In the midst of a crisis, the markets don’t hit a “reset button” and start afresh just because everyone flips the calendar ahead to a new month. A crisis will play out independent of a calendar, taking however long it will take. In the case of the S&P 500, compounding month after month of epic losses resulted in a maximum drawdown of over 50% between August 2007 and February 2009. And yet standard deviation treats those months as independent observations, each one distinct from the next.
Standard deviation is a classroom concept; capital preservation is a real-world issue.
This is where the pain index comes in.
Developed by Dr. Thomas Becker and Aaron Moore of Zephyr Associates, the Pain Index is similar to other measures of risk like standard deviation, beta, tracking error, etc. Where it differs, however, is in its definition of risk.
As a capital preservation metric, the pain index measures risk in losses. Specifically, it measures the depth, duration, and frequency of losses.
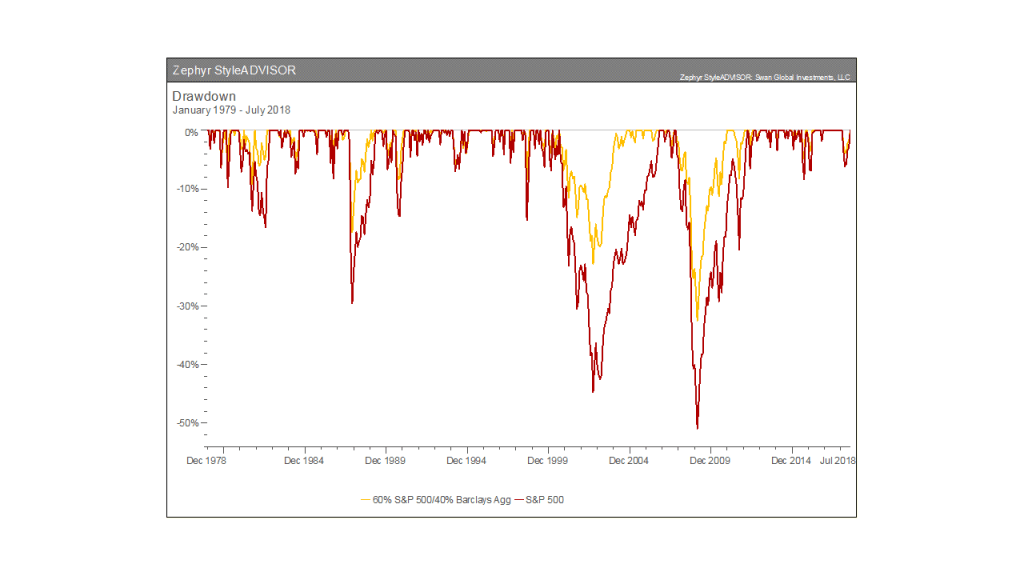
In the graph below, we look at a 20-year period with two full-market cycles (both a bull and bear market), from July 1997 to July 2018. The red line represents the peak-to-trough losses associated with the S&P 500. If one were to fill in the entire area between the drawdown line and the break-even line, it would encapsulate three things: the depth of losses, the duration of losses, and the frequency of losses. These three results are exactly what the pain index measures.
 Source: Zephyr StyleADVISOR
The pain index essentially measures the “volume” between the break-even line and the drawdown line. If the above lines are thought of as measuring cups, the pain index is the volume of liquid required to fill the drawdown space. The deeper the losses, the longer the losses and the more frequent the losses, the larger the volume of “pain.”
The steepest drawdown was the credit crisis of 2007-08 when the S&P 500 lost over 50%. However, the longest drawdown was the dot-com bust of 2000–2002. During that stretch, the market was down “only” 45% but took longer to recover its losses- 49 months for the dot-com bust, 37 months for the credit crisis, as we can see in the chart above.
When looking at the pain index measurement, the investor would prefer that volume to be as small as possible. The smaller the pain index, the better. A zero would be the best, indicating the manager never lost money.
The safest investments with the lowest pain indexes are likely to be those investments with scarcely any upside, like savings accounts, certificates of deposit, or money markets.
The pain index measures risk in terms most investors think about risk: how much money they might lose.
Putting risk in terms investors understand is important for helping them decide on funds and managers that suit their objectives and needs. Empathizing with their concerns and doing so with proper measurements can help you gain your clients’ trust and bolster your client relationship.
The pain index is great for investors who are more concerned with capital preservation above all else. But since investing is all about optimizing returns against risks, we ideally want a metric that measures the balance of the pain index against a measure of return. This is the purpose of the pain ratio, which I’ve discussed in a different post.
Marc Odo, CFA®, CAIA®, CIPM®, CFP®, Client Portfolio Manager, is responsible for helping clients and prospects gain a detailed understanding of Swan’s Defined Risk Strategy, including how it fits into an overall investment strategy. Formerly, Marc was the Director of Research for 11 years at Zephyr Associates.
Swan Global Investments, LLC is a SEC registered Investment Advisor that specializes in managing money using the proprietary Defined Risk Strategy (“DRS”). SEC registration does not denote any special training or qualification conferred by the SEC. Swan offers and manages the DRS for investors including individuals, institutions and other investment advisor firms. Any historical numbers, awards and recognitions presented are based on the performance of a (GIPS®) composite, Swan’s DRS Select Composite, which includes non-qualified discretionary accounts invested in since inception, July 1997, and are net of fees and expenses. Swan claims compliance with the Global Investment Performance Standards (GIPS®).
All Swan products utilize the Defined Risk Strategy (“DRS”), but may vary by asset class, regulatory offering type, etc. Accordingly, all Swan DRS product offerings will have different performance results due to offering differences and comparing results among the Swan products and composites may be of limited use. All data used herein; including the statistical information, verification and performance reports are available upon request.
The MSCI (Morgan Stanley Capital International) EAFE index comprises the MSCI country indexes capturing large and mid-cap equities across developed markets, excluding the U.S. and Canada. The MSCI(Morgan Stanley Capital International) Emerging Markets Index is designed to measure equity market performance in global emerging markets. Indexes are unmanaged and have no fees or expenses. An investment cannot be made directly in an index. Swan’s investments may consist of securities which vary significantly from those in the benchmark indexes listed above and performance calculation methods may not be entirely comparable. Accordingly, comparing results shown to those of such indexes may be of limited use. The adviser’s dependence on its DRS process and judgments about the attractiveness, value and potential appreciation of particular ETFs and options in which the adviser invests or writes may prove to be incorrect and may not produce the desired results. There is no guarantee any investment or the DRS will meet its objectives. All investments involve the risk of potential investment losses as well as the potential for investment gains. Prior performance is not a guarantee of future results and there can be no assurance, and investors should not assume, that future performance will be comparable to past performance. All investment strategies have the potential for profit or loss. Further information is available upon request by contacting the company directly at 970–382-8901 or www.www.swanglobalinvestments.com. 372-SGI-092118