This site uses cookies. By continuing to browse the site, you are agreeing to our use of cookies. Privacy Policy
Okay, thanksIn previous blog posts, we discussed the impact of “curveballs” on retirement planning:
The first curveball was the impact of timing in the post “Timing is Everything? Or is It?” We explored how the success or failure of an investment plan is due in large part to when an initial investment was made, a seemingly random variable. Over the time horizon analyzed, the ending value of a $100,000 investment in the S&P 500 after ten years could have been as high as $356,657or as low as $87,006, based solely upon which January 1st the individual opted to make the initial investment.
The take-away is that if you can’t predict it, it makes it very difficult to plan for it.
The second curveball is the impact of taking withdrawals from an investment plan, discussed in “Suffering from Withdrawals?” As investors shift from the accumulation to distribution stages of their life cycle, the negative consequences of large bear markets become much more pronounced. Market drawdowns are no longer opportunities to “buy on a low.” Instead, retirees are forced to liquidate their holdings during times of market weakness.
The take-away from that post is withdrawing funds from a sinking market makes it all the more difficult to recover losses.
In this blog post, we combine these two analyses into what we call a “WIT Analysis.”
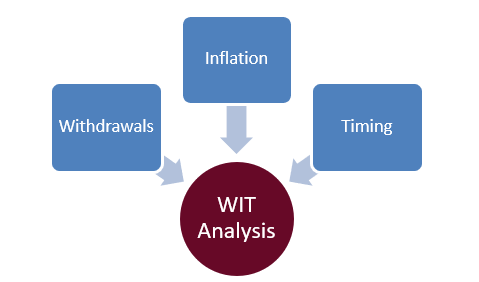
This explores the combined impact of withdrawals, inflation, and timing on an investment.
The intent in using a WIT analysis is to examine how an investment plan might look after a decade in the real world if a retiree is forced to take withdrawals and had the bad luck of investing at the wrong time.
Like we did in previous posts, we assume an initial investment of $1,000,000 in one of three options:
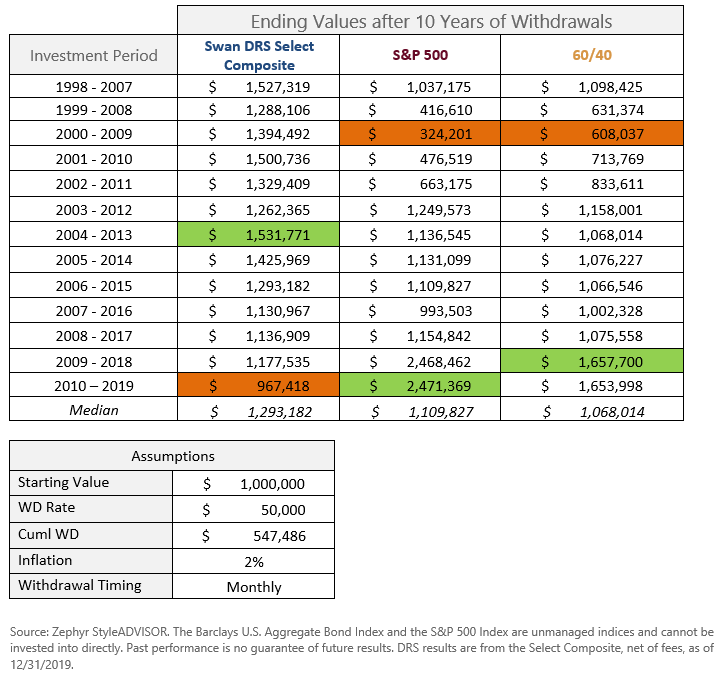
Each investment is made for ten years, starting on January 1st. The results are “rolled forward” yearly, meaning the first investment period extended from 1/1/98 to 12/31/07, the second investment period was from 1/1/99 to 12/31/08, and so forth.
However, rather than assuming a simple buy-and-hold for each of those decades, we introduce the idea of taking out withdrawals, adjusted for inflation.
At the end of each year, we take out $50,000, adjusted for a 2% inflation rate.
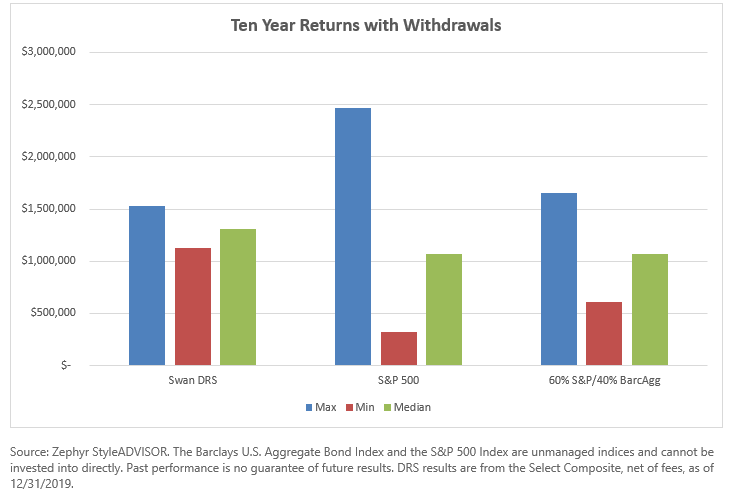
After ten years and $547,486 of withdrawals, the median investment in the S&P 500 still had a remaining value of $1,109,827. However, that average masks a lot of variability:
That unlucky investor was subject to not one but two major bear markets. Forced to take withdrawals in the down years of 2000, 2001, 2002, and 2008. The pool of capital remaining was only $324,201 at the end of 2009.
The traditional 60/40 portfolio had similar ending values as the S&P 500 but with less variability between best and worst.
The Swan DRS Select Composite posted the best results of the three. The median ending value after a decade, taking out the same $547,486 of withdrawals, was $1,293,182. There was little dispersion between the best decade and the worst decade with values of $1,531,771 and $967,418, respectively.
Full results are below:
These results illustrate the prime objective of the Defined Risk Strategy: to strike the right balance between upside participation during bull markets and downside protection during bear markets. In doing so, we have typically been able to mitigate the sequence risk that plagues many retiree investors as they are in the distribution phase.
Since its inception in July 1997, the DRS Select Composite has successfully navigated through three bull markets and two bear markets.
We are often asked, “What is the appropriate time horizon in which to measure the DRS’s performance?” Our answer to that question is always a full market cycle—one that incorporates a bull and a bear. Except for two, each of the decades in this WIT analysis contain at least one bull and one bear market.
Marc Odo, CFA®, CAIA®, CIPM®, CFP®, Client Portfolio Manager, is responsible for helping clients and prospects gain a detailed understanding of Swan’s Defined Risk Strategy, including how it fits into an overall investment strategy. Formerly Marc was the Director of Research for 11 years at Zephyr Associates.
*Originally published February 2016
Swan Global Investments, LLC is a SEC registered Investment Advisor that specializes in managing money using the proprietary Defined Risk Strategy (“DRS”). SEC registration does not denote any special training or qualification conferred by the SEC. Swan offers and manages the DRS for investors including individuals, institutions and other investment advisor firms. Any historical numbers, awards and recognitions presented are based on the performance of a (GIPS®) composite, Swan’s DRS Select Composite, which includes non-qualified discretionary accounts invested in since inception, July 1997, and are net of fees and expenses. Swan claims compliance with the Global Investment Performance Standards (GIPS®).
All Swan products utilize the Defined Risk Strategy (“DRS”), but may vary by asset class, regulatory offering type, etc. Accordingly, all Swan DRS product offerings will have different performance results due to offering differences and comparing results among the Swan products and composites may be of limited use.
All data used herein; including the statistical information, verification and performance reports are available upon request. The S&P 500 Index is a market cap weighted index of 500 widely held stocks often used as a proxy for the overall U.S. equity market. Indexes are unmanaged and have no fees or expenses. An investment cannot be made directly in an index. Swan’s investments may consist of securities which vary significantly from those in the benchmark indexes listed above and performance calculation methods may not be entirely comparable. Accordingly, comparing results shown to those of such indexes may be of limited use. The adviser’s dependence on its DRS process and judgments about the attractiveness, value and potential appreciation of particular ETFs and options in which the adviser invests or writes may prove to be incorrect and may not produce the desired results. There is no guarantee any investment or the DRS will meet its objectives. All investments involve the risk of potential investment losses as well as the potential for investment gains. Prior performance is not a guarantee of future results and there can be no assurance, and investors should not assume, that future performance will be comparable to past performance. All investment strategies have the potential for profit or loss. Further information is available upon request by contacting the company directly at 970-382-8901 or www.swanglobalinvestments.com. 080-SGI-022620