This site uses cookies. By continuing to browse the site, you are agreeing to our use of cookies. Privacy Policy
Okay, thanksWhen analyzing the performance of money managers, the industry standard assumes a single investment is made at the start of period and that no additional deposits or withdrawals are made. Cash flows in or out of an investment are assumed to be outside of the control of a portfolio manager, and therefore shouldn’t be used to judge the effectiveness of a portfolio manager’s investment skills. This methodology is known as time weighted returns.
However, when analyzing the suitability of an investment for an actual individual, how realistic is it to assume that the investor makes no contributions or withdrawals over a span of five, ten, or twenty years?
In the real world, most investors are either in the accumulation or distribution stages, where contributions or withdrawals are indeed occurring.
So the question becomes, how much can cash flows impact the financial well-being of an investor?
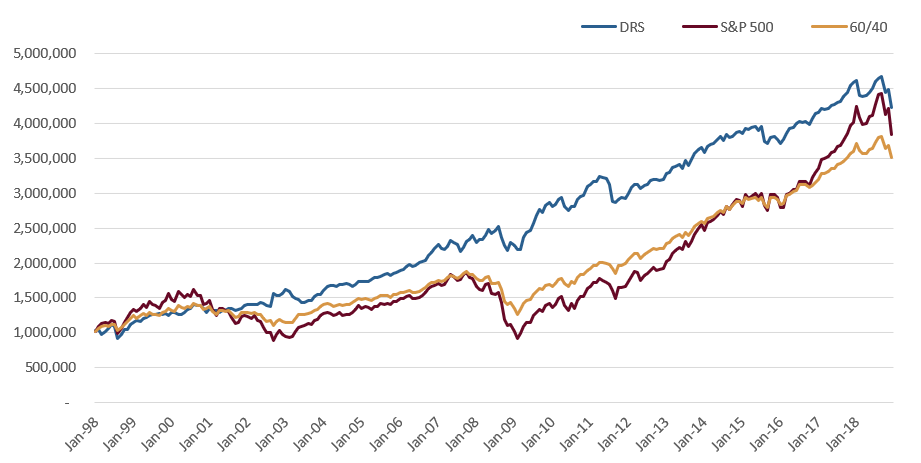
In this example we will consider an investor with a starting portfolio value of $1 million and invested between January 1st, 1998 and December 31st, 2018. We explore three investments alternatives, namely:
In the first case, we assume a single investment with no cash flows: the standard, sterilized time-weighted return analysis.


Source: Zephyr StyleADVISOR, Swan Global Investments. All data based on historical performance of the Swan DRS Select Composite, the S&P Total Return Index and a 60% S&P 500/40% Barclays Aggregate Bond blend. The Barclays U.S. Aggregate Bond Index and the S&P 500 Index are unmanaged indices and cannot be invested into directly. Prior performance is not a guarantee of future results.
In the above case, because all have positive average annual returns over the 20 years and with no withdrawals taken, the ending value of the investment is significantly higher than the initial investment.
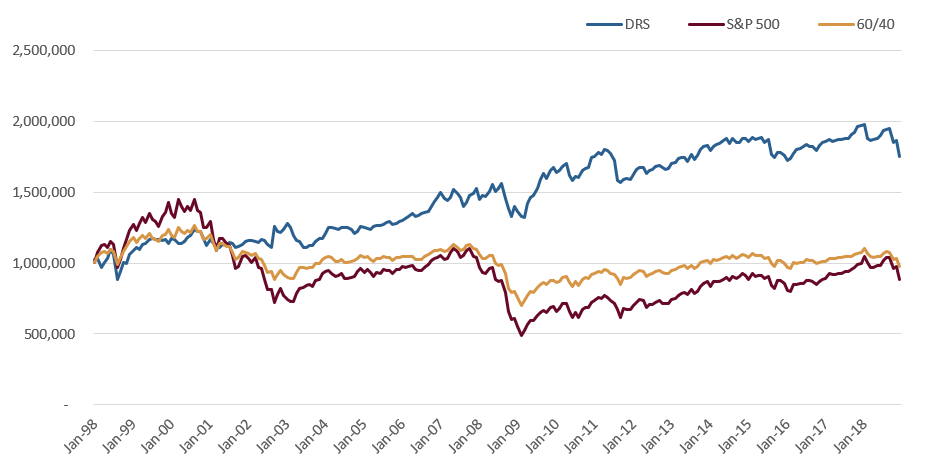
But what if the investor is retired and in the distribution stage? What if the investor takes out $50,000 a year and grows that by 2% a year to account for inflation? What impact would that have on the investment?
Once withdrawals are begun, the ending value of the portfolio is significantly different for the different investment strategies:


Source: Zephyr StyleADVISOR, Swan Global Investments. All data based on historical performance of the Swan DRS Select Composite, the S&P Total Return Index and a 60% S&P 500/40% Barclays Aggregate Bond blend. The Barclays U.S. Aggregate Bond Index and the S&P 500 Index are unmanaged indices and cannot be invested into directly. Prior performance is not a guarantee of future results. *Calculations based on monthly withdrawals totaling to $50,000 per year plus 2% inflation are assumed.
As one can see here, including withdrawals can have an extreme impact on the value of an investment.
For the retiree, bear markets are no longer a golden buying opportunity. An investor in the distribution stage of their life cycle is forced to liquidate holdings at a market low.
So if the market sells off 45% over the course of three years, like it did in 2000-2002, the principal left to make a recovery will be much more diminished after the investor was taking out an additional 6% each year to meet living expenses.
Withdrawing funds in a bear market just makes the hole deeper, the dark side of compounding returns.
One of the reasons that the DRS ends with a higher value than the S&P 500 and the traditional 60/40 portfolio scenarios is because it actively seeks to limit the impact of large losses, like bear markets.
By design, the DRS was meant to minimize losses. One of the core beliefs of Swan Global Investments is that the best way to make money is to not lose it in the first place. This is especially important for those investors in the retirement stage, drawing down their accounts to fund living expenses. That is why the DRS always hedges the portfolio against catastrophic market losses: to seek a better position for investors to live their lives without fear of running out of money.
Marc Odo, CFA®, CAIA®, CIPM®, CFP®, Client Portfolio Manager, is responsible for helping clients and prospects gain a detailed understanding of Swan’s Defined Risk Strategy, including how it fits into an overall investment strategy. Formerly Marc was the Director of Research for 11 years at Zephyr Associates.

Swan Global Investments, LLC is a SEC registered Investment Advisor that specializes in managing money using the proprietary Defined Risk Strategy (“DRS”). SEC registration does not denote any special training or qualification conferred by the SEC. Swan offers and manages the DRS for investors including individuals, institutions and other investment advisor firms. Any historical numbers, awards and recognitions presented are based on the performance of a (GIPS®) composite, Swan’s DRS Select Composite, which includes non-qualified discretionary accounts invested in since inception, July 1997, and are net of fees and expenses. The Swan Defined Risk Strategy Select Composite demonstrates the performance of non-qualified assets managed by Swan Global Investments, LLC since inception. It includes discretionary individual accounts whose account holders seek the upside potential of owning stock, and the desire to eliminate most of the risk associated with owning stock. The Composite relies on LEAPS and other options to manage this risk. Individual accounts own S&P 500 exchange traded funds and LEAPS associated with the exchange traded funds as well as multiple other option spreads that represent other indices that are widely traded. The Defined Risk Strategy was designed to protect investors from substantial market declines, provide income in flat or choppy markets, and to benefit from market appreciation. Stock and options are the primary components of the strategy.
Swan claims compliance with the Global Investment Performance Standards (GIPS®) and has prepared and presented this report in compliance with GIPS. Swan’s compliance with GIPS has been independently verified for the periods July 1, 1997 through December 31, 2017. The Spaulding Group conducted Swan’s verification. The three-year annualized standard deviation measures the variability of the composite and the benchmarks over the preceding 36-month period. The dispersion of annual returns is measured by the standard deviation of asset-weighted portfolio returns represented within the composite for the full year. For those periods with five or fewer portfolios included for the entire year, dispersion is not presented. A copy of the verification report is available upon request. To receive copies of the report, please call (970) 382-8901 or email [email protected]. Verification assesses whether (1) the firm has complied with all the composite construction requirements of GIPS on a firm-wide basis, and (2) the firm’s policies and procedures are designed to calculate and present performance in compliance with GIPS. Verification does not ensure the accuracy of any specific composite presentation. All data used herein; including the statistical information, verification and performance reports are available upon request.
The S&P 500 Index is a market cap weighted index of 500 widely held stocks often used as a proxy for the overall U.S. equity market. Indexes are unmanaged and have no fees or expenses. An investment cannot be made directly in an index. Swan’s investments may consist of securities which vary significantly from those in the benchmark indexes listed above and performance calculation methods may not be entirely comparable. Accordingly, comparing results shown to those of such indexes may be of limited use. The adviser’s dependence on its DRS process and judgments about the attractiveness, value and potential appreciation of particular ETFs and options in which the adviser invests or writes may prove to be incorrect and may not produce the desired results. There is no guarantee any investment or the DRS will meet its objectives. All investments involve the risk of potential investment losses as well as the potential for investment gains. Prior performance is not a guarantee of future results and there can be no assurance, and investors should not assume, that future performance will be comparable to past performance. All investment strategies have the potential for profit or loss. Further information is available upon request by contacting the company directly at 970.382.8901 or visit www.www.swanglobalinvestments.com 154-SGI-040319