One of the more frequent questions we receive at Swan Global Investments is:
“What is the appropriate benchmark for the Defined Risk Strategy?”
It’s a legitimate question. The Defined Risk Strategy (DRS) is a unique solution and standard off-the-shelf indices aren’t ideal benchmarks. It is important to remember our goal is to outperform both the S&P 500 and a balanced equity/bond portfolio over a full market cycle, which by definition includes both a bull and bear market. However, a full market cycle can take quite a long time to unfold. Just witness our current bull market, now in its ninth year.
So, how should the DRS’s performance be evaluated over shorter periods of time?
We believe that our Target Return Band is a very appropriate prism through which our performance can be viewed. The three main elements of the Defined Risk Strategy are represented in the Target Return Band:
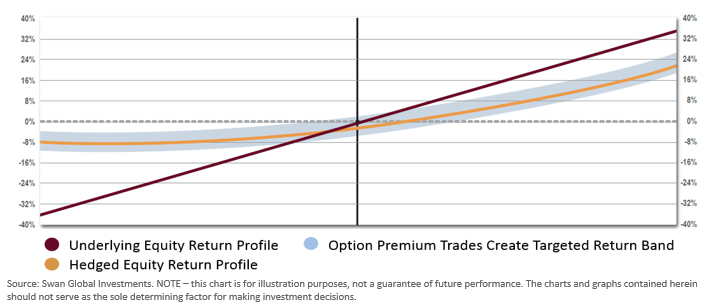
The main idea is that at any given return level of the S&P 500, the DRS’s return should fall either within or above the blue range. If our returns fall within this targeted return band in the shorter-term (one year), we believe we will be on track to beat both the market and a balanced equity/bond portfolio over a full market cycle.
Let’s breakdown this benchmark further.
First, we start with the burgundy colored line. This diagonal-like line represents the return profile of the S&P 500.
This element is simple and straight-forward: It represents a long position in passively-managed ETFs. An investment in a S&P 500-based mutual fund or ETF seeks returns that correspond substantially to the returns of the S&P 500 index[1].
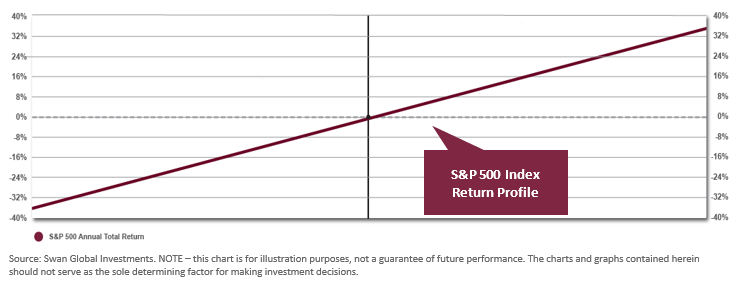
The problem with this kind of passive, buy-and-hold approach is that it has unlimited downside risk. The market can sell off by 20%, 30%, 40% or more and has done so many times through history. Such losses can be catastrophic and require years for a portfolio to recover.
To protect against these types of major losses, the second component of the DRS is to overlay the ETF positions with put options to hedge against downside risk.
The return profile of this combined equity-and-hedge position is seen in the gold line below.
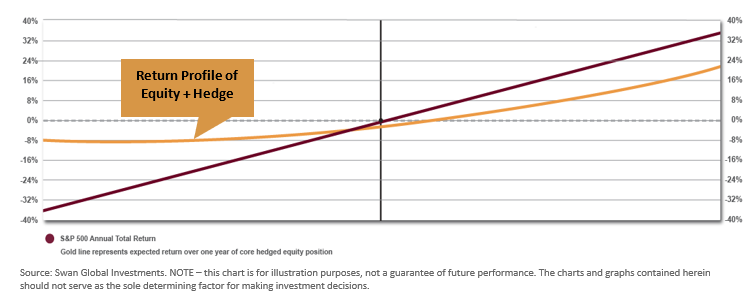
The gold line lags the S&P 500 in up markets but is still upward sloping, so the DRS’s potential upside capture is not capped.
In down markets, however, the value of the hedge is readily evident. As the S&P 500 drops, the hedged equity positions flatten out. At a certain point, the slope of the curve is flat or 0, meaning that the hedged equity position is insulated from further losses in the market. The value of downside protection is clear and is explored in-depth in previous blog posts on avoiding large losses and the importance of distribution of returns.
That said, in a flat or up market the hedge does act as a drag on performance.
The third element to the Defined Risk Strategy is the short-term, market-neutral premium collection trades. These are meant to be an additional source of return that is not dependent on the overall direction of the market.
The impact is seen by overlaying the premium collection trades on top of the hedged equity position and is represented by the blue band below:
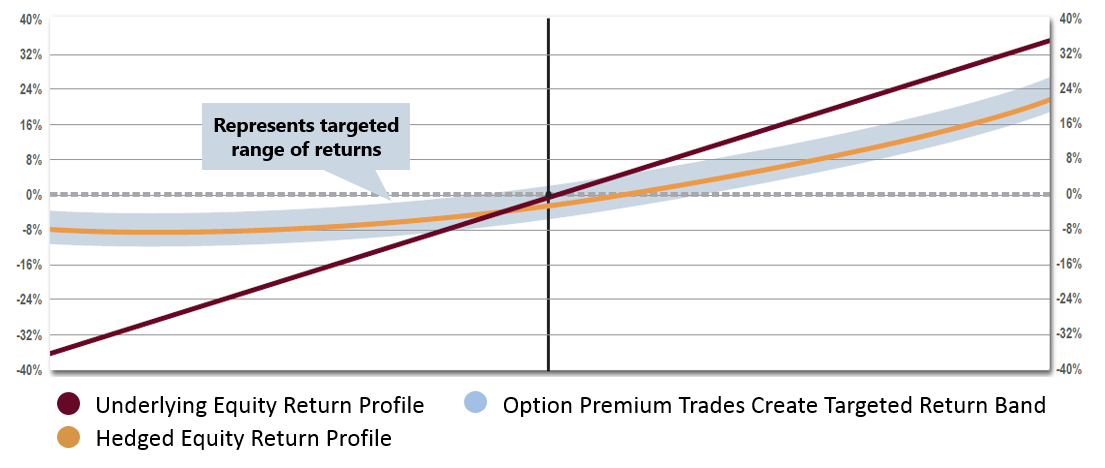
While the premium collection trades add a bit of uncertainty to the equation, more often than not, these trades have been a net positive to performance and have boosted the DRS’s returns above what would have been expected by just the hedged equity component alone.
The upper range of the blue band represents the average annual return generated by the income component throughout the history of the DRS.
However, there have been times when the income trades have been detrimental to the DRS’s performance. The lower range of the blue band is defined by the worst single-year return of the income trades.
By using the average income return to define the upside and the historical worst return to define the downside, the blue band is a more conservative way of anticipating the DRS’s overall returns.
We believe the targeted return band is the most appropriate shorter-term benchmark for the Defined Risk Strategy.
In any given year, it is our goal that returns of the DRS will be within or above the blue shaded area. In 20 of the 21 years, they have been.
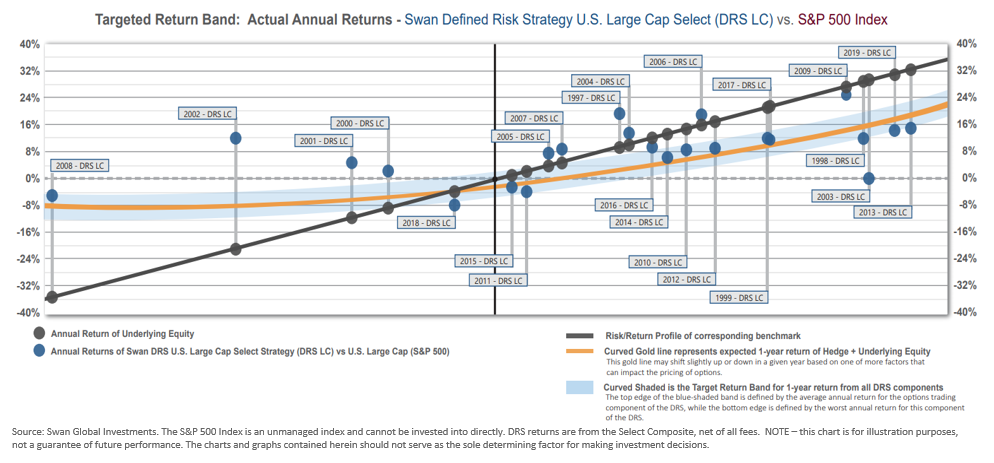
The one year where the DRS’s returns fell outside its expected return range was 2003. That year Swan stepped outside its normal investment philosophy and came into the year with the portfolio over-hedged, which exposed it to the risks of taking a directional bet on the market.
The Target Return Band drives our thinking when it comes to applying the DRS to other asset classes as well.
The DRS has almost two decades of live, verified results utilizing U.S. large cap stocks.
In recent years, Swan has been applying the DRS to other asset classes like U.S. small cap, foreign developed, emerging markets, gold, and long-term Treasuries. In all of these cases, the Target Return Band has been very accurate in judging the actual or simulated results of applying the DRS to other asset classes.
It is our opinion that too much emphasis has been placed upon “beating the market”.
The short-termism or preoccupation with comparing performance against the S&P 500 on a yearly, quarterly, monthly, and/or daily basis mirrors the myopic focus that many company analysts have on individual companies beating their quarterly earnings estimates. The inherent risk in such an approach is that one may start to lose the forest for the trees.
At Swan, our objective is to outperform over the full market cycle, rather than to ‘beat the market’ in any short-term period. We believe achieving returns within the targeted return band year after year can lead to long-term success.
Investors generally have goals that require years or even decades to accomplish. With such longer-term horizons, we believe the goals of an investor should mirror the goal of the DRS: to produce stable, consistent results. Over our 20-year history, that is exactly what we have strived to achieve.
Marc Odo, CFA®, CAIA®, CIPM®, CFP®, Client Portfolio Manager, is responsible for helping clients and prospects gain a detailed understanding of Swan’s Defined Risk Strategy, including how it fits into an overall investment strategy. Formerly Marc was the Director of Research for 11 years at Zephyr Associates.
[1] It should be noted that Swan Global Investments (SGI) manages several US Large Cap versions of the Defined Risk Strategy (DRS) via separately managed accounts. The Defined Risk US Large Cap Sectors Select Strategy, utilizes S&P 500 sector ETFs for its passive underlying equity exposure. For this DRS version, from 2012 through 2020, SGI saught to maintain a relative equal-weighted sector approach, rather than the capitalization-weighted methodology of the S&P 500. That led to some dispersion in performance versus the S&P 500 Index and the cap-weighted. Beginning at the end of 2020 and through early 2021, SGI adjusted the weightings of those sector ETFs and added cap-weighted SP500 ETFs to the underlying equity holdings to more closely align with the cap-weighted S&P 500.
Swan Global Investments, LLC is a SEC registered Investment Advisor that specializes in managing money using the proprietary Defined Risk Strategy (“DRS”). SEC registration does not denote any special training or qualification conferred by the SEC. Swan offers and manages the DRS for investors including individuals, institutions and other investment advisor firms. Any historical numbers, awards and recognitions presented are based on the performance of a (GIPS®) composite, Swan’s DRS Select Composite, which includes non-qualified discretionary accounts invested in since inception, July 1997, and are net of fees and expenses. Swan claims compliance with the Global Investment Performance Standards (GIPS®). All Swan products utilize the Defined Risk Strategy (“DRS”), but may vary by asset class, regulatory offering type, etc. Accordingly, all Swan DRS product offerings will have different performance results, and comparing results among the Swan products and composites may be of limited use. All data used herein; including the statistical information, verification and performance reports are available upon request. The S&P 500 Index is a market cap weighted index of 500 widely held stocks often used as a proxy for the overall U.S. equity market. Indexes are unmanaged and have no fees or expenses. An investment cannot be made directly in an index. Swan’s investments may consist of securities which vary significantly from those in the benchmark indexes listed above and performance calculation methods may not be entirely comparable. Accordingly, comparing results shown to those of such indexes may be of limited use. The adviser’s dependence on its DRS process and judgments about the attractiveness, value and potential appreciation of particular ETFs and options in which the adviser invests or writes may prove to be incorrect and may not produce the desired results. There is no guarantee any investment or the DRS will meet its objectives. All investments involve the risk of potential investment losses as well as the potential for investment gains. Prior performance is not a guarantee of future results and there can be no assurance, and investors should not assume, that future performance will be comparable to past performance. All investment strategies have the potential for profit or loss. Further information is available upon request by contacting the company directly at 970.382.8901 or visit www.swanglobalinvestments.com 081-SGI-022620