This site uses cookies. By continuing to browse the site, you are agreeing to our use of cookies. Privacy Policy
Okay, thanksMany investors are familiar with the “Rule of 72.” Quick, useful, and easy to understand, the Rule of 72 is a popular mathematical shortcut that estimates how long it would take to double one’s investment, given an average annualized compounding return rate. The formula is simple:

The Rule of 72 is popular because it does not require any fancy Greek symbols, advanced math, or complex functions. Behind the scenes there is some interesting, higher level math going on, but figuratively speaking one doesn’t need to know how the car is built in order to drive it.
It’s a handy mental shortcut and an easy concept for investors to understand when explaining the significance of the relationship between risk tolerance, time horizon, and required return—essential for any goals-based plan. At its core, the Rule of 72 is another illustration of the power of compounding returns.
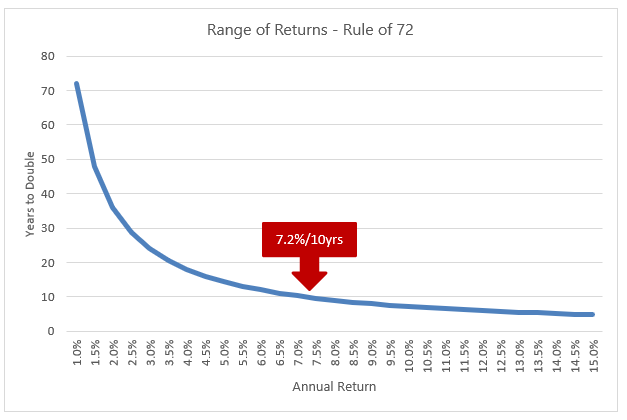
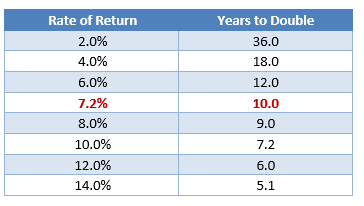
Looking at a range of returns, we can see how long it would take an investment to double at different intervals.


Source: Swan Global Investments
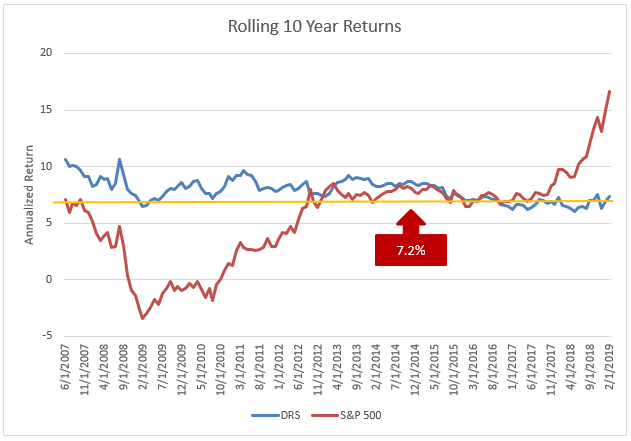
With an average annualized return, it’s important to acknowledge that there is some variability to long-term returns. Some periods are better or worse than others. The graph below shows the rolling, 10-year returns of the DRS.

Source: Swan Global Investments, Zephyr StyleADVISOR. All data based on historical performance of the S&P Total Return Index and the Swan DRS Select Composite. Prior performance is not a guarantee of future results.

Source: Swan Global Investments, Zephyr StyleADVISOR. All data based on historical performance of the S&P Total Return Index and the Swan DRS Select Composite. Prior performance is not a guarantee of future results.
But what if someone had terrible timing with the DRS? What if someone invested in on June 1st, 2008, and experienced the worst 10-year period in the DRS’s history?
In that case, the 10-year annualized return was 6.0%. According to the Rule of 72, a 6% trajectory takes 12 years to double an investment. At the end of ten years at a 6% rate of return, a $100 investment would be worth $179. Not ideal, but if that is the absolute worst decade in the DRS’s history, it should be a worst-case scenario most investors are willing to live with, especially compared to potential worst-cases for fixed income or buy-and-hold equities.
Finally, much has been made of the recent 10-year anniversary of the bull market, starting in early March 2009. The DRS’s value proposition has always been to provide respectable returns through large, bear-market sell-offs. But what happens if the market doesn’t experience a bear market loss of 20% or more? Can the DRS still deliver?
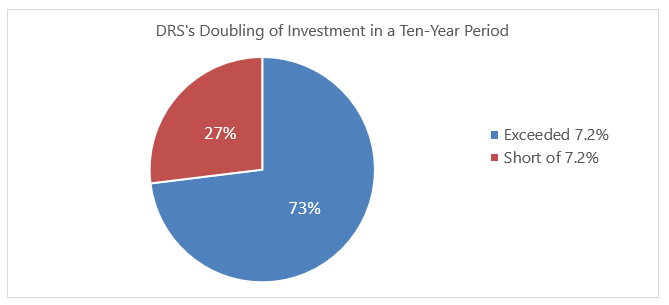
The ten-year return of the DRS through February 28th, 2019 was 7.32%. Even in a period lacking a big, bear market drawdown, the DRS was able to exceed the 7.2% threshold to double an investment over a decade.
The Defined Risk Strategy has always been designed as a long-term investment strategy. The goal is to build wealth and mitigate the impact of big, bear markets so investors have the money when they need it. Markets tend to be “feast or famine”, either providing very strong or very poor returns, sometimes making it difficult for goals-based financial plans to meet their needs.
The DRS attempts to sail between those extremes, providing a decent, respectable rate of return that can harness the power of the Rule of 72 and build wealth.
 Marc Odo, CFA®, CAIA®, CIPM®, CFP®, Client Portfolio Manager, is responsible for helping clients and prospects gain a detailed understanding of Swan’s Defined Risk Strategy, including how it fits into an overall investment strategy. Formerly, Marc was the Director of Research at Zephyr Associates for 11 years
Swan Global Investments, LLC is a SEC registered Investment Advisor that specializes in managing money using the proprietary Defined Risk Strategy (“DRS”). SEC registration does not denote any special training or qualification conferred by the SEC. Swan offers and manages the DRS for investors including individuals, institutions and other investment advisor firms. Any historical numbers, awards and recognitions presented are based on the performance of a (GIPS®) composite, Swan’s DRS Select Composite, which includes non-qualified discretionary accounts invested in since inception, July 1997, and are net of fees and expenses. Swan claims compliance with the Global Investment Performance Standards (GIPS®).
All Swan products utilize the Defined Risk Strategy (“DRS”), but may vary by asset class, regulatory offering type, etc. Accordingly, all Swan DRS product offerings will have different performance results due to offering differences and comparing results among the Swan products and composites may be of limited use. All data used herein; including the statistical information, verification and performance reports are available upon request. The S&P 500 Index is a market cap weighted index of 500 widely held stocks often used as a proxy for the overall U.S. equity market. Indexes are unmanaged and have no fees or expenses. An investment cannot be made directly in an index. Swan’s investments may consist of securities which vary significantly from those in the benchmark indexes listed above and performance calculation methods may not be entirely comparable. Accordingly, comparing results shown to those of such indexes may be of limited use. The adviser’s dependence on its DRS process and judgments about the attractiveness, value and potential appreciation of particular ETFs and options in which the adviser invests or writes may prove to be incorrect and may not produce the desired results. There is no guarantee any investment or the DRS will meet its objectives. All investments involve the risk of potential investment losses as well as the potential for investment gains. Prior performance is not a guarantee of future results and there can be no assurance, and investors should not assume, that future performance will be comparable to past performance. All investment strategies have the potential for profit or loss. Further information is available upon request by contacting the company directly at 970-382-8901 or www.swanglobalinvestments.com.143-SGI-032819