This site uses cookies. By continuing to browse the site, you are agreeing to our use of cookies. Privacy Policy
Okay, thanksEvery year has its collection of random and rare market occurrences. 2017 broke many records with its low volatility, lack of intra-day movement, and positive moves; for the first time in history, all twelve months of the year were positive. 2018 appeared to be a bit of a reaction to the extremes of 2017.
Overall, a rolling global bear market created one of the worst years across asset classes in the past decade. There was nowhere to hide in 2018 as both domestic and international equities, as well as fixed income, high yield, and even commodities such as gold and oil, finished the year in the red.
In 2018, the market was a rollercoaster at the beginning and end of the year with a calmer ride during the middle. Even though 2018 was the first negative year in the stock market since 2008, to many 2018 seemed like a “typical” year since it only finished down -4.38%. But that number masked record-breaking corrections and unique never-before-seen occurrences.
The chart below illustrates some of the larger moves up and down from 2018. It highlights the whipsaw nature of the first and fourth quarters and the sharpness and severity of the corrections associated with those two selloffs.
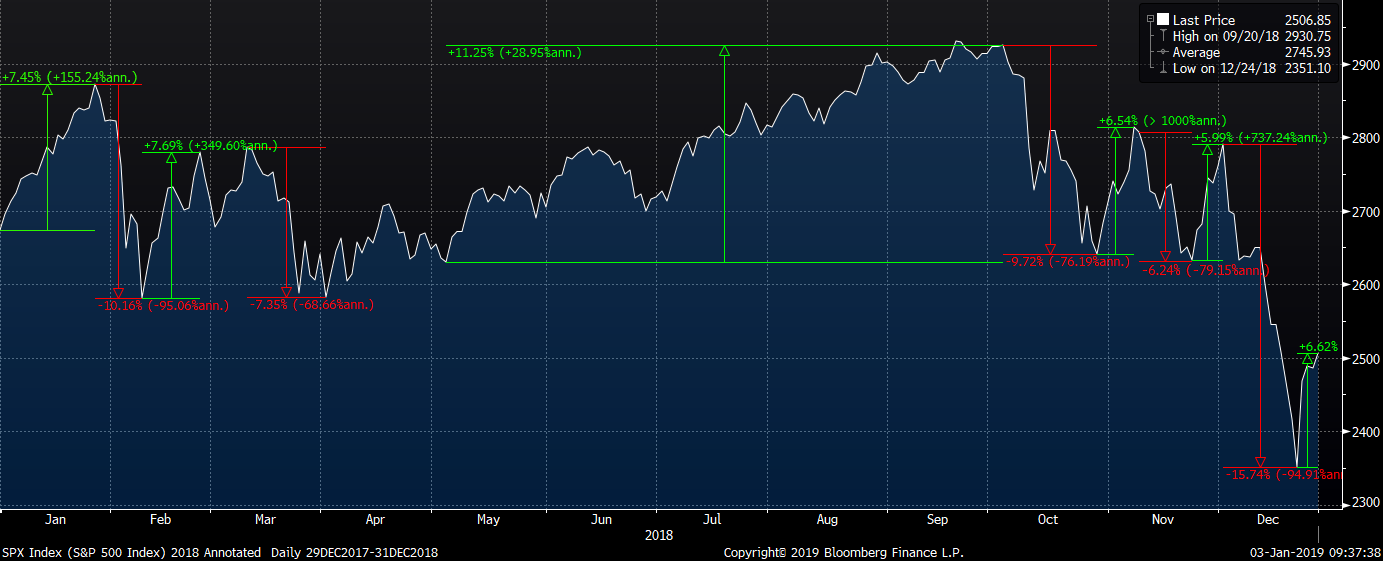
Source: Bloomberg
But a lot of strange or rare occurrences happened in 2018, from either market movements or in the area of volatility.
Below is a handful of stats that show the record-breaking nature of 2018 and some of its unique and rare occurrences:
Source: Morningstar, Zephyr StyleAdvisor, and SGI – Years Since 1974
The VIX also saw some rare occurrences:
Finally, virtually all of these unusual, volatile events were packed into just two quarters: Q1 and Q4 of 2018. The second and third quarters were mostly docile.
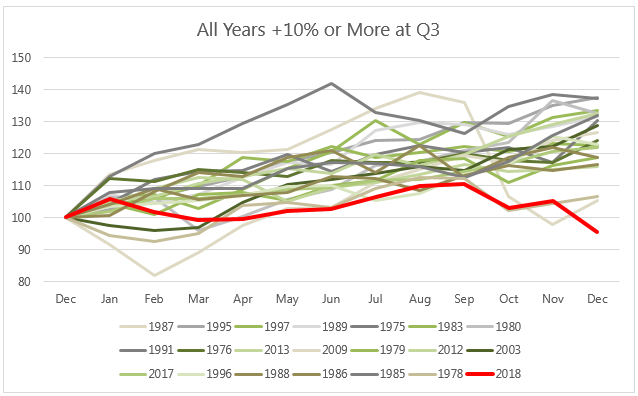
So, what does all this mean for 2019? As of the end of January, 2019 began with the fifth best January since 1923. A reason to be bullish? Not necessarily. Evidence that 2019 will be just like 2018? No. Does it mean anything as to the rest of the year’s action? Nothing—just data points on what has happened in the past based on a random, calendar-driven frame of reference and the complex movements of a broad U.S. stock market index.
It’s important to not let confirmation bias decide something for you. Confirmation bias is the tendency to interpret evidence as confirmation of one’s beliefs or theories. Of course, this could be said about any attempt to predict the stock market one way or the other. What the market has done in the past has no bearing on what it will do in the future; it just provides a frame of reference for what could be considered normal or abnormal.
There’s an old saying, “The more things change, the more they stay the same.” It is important to remember that while each year in the markets is different, fundamental truths persist through the decades. Each year in the market brings about new records, new firsts, new never-before-seen events and occurrences. Yet understanding where the market has been and where it can go is an important part of defining and understanding risk, so it can be managed.
At Swan, we believe a proven, consistent, approach to mitigating downside risk over a full market cycle can potentially help investors accept the risks that are in the market while ignoring the noise that comes with ever-changing calendar year environments. Because it is impossible to know what the market is going to do, we are always invested and always hedged.
Whatever 2019 brings, here’s to defining risk and a prosperous year.
Micah Wakefield, CAIA®, Portfolio Manager and Director of Research & Product Development, helps oversee and review the core equity holdings for the strategies and assists with daily risk assessment and position review. He also leads research and development of strategies and products at Swan.
Sources: CBOE, Bloomberg, UBS, and LPL Research, with additional credit to @tihobrkan, @oddstats, and @charliebilello
Swan Global Investments, LLC is a SEC registered Investment Advisor that specializes in managing money using the proprietary Defined Risk Strategy (“DRS”). SEC registration does not denote any special training or qualification conferred by the SEC. Swan offers and manages the DRS for investors including individuals, institutions and other investment advisor firms. Any historical numbers, awards and recognitions presented are based on the performance of a (GIPS®) composite, Swan’s DRS Select Composite, which includes non-qualified discretionary accounts invested in since inception, July 1997, and are net of fees and expenses. Swan claims compliance with the Global Investment Performance Standards (GIPS®).
All Swan products utilize the Defined Risk Strategy (“DRS”), but may vary by asset class, regulatory offering type, etc. Accordingly, all Swan DRS product offerings will have different performance results due to offering differences and comparing results among the Swan products and composites may be of limited use. All data used herein; including the statistical information, verification and performance reports are available upon request. The S&P 500 Index is a market cap weighted index of 500 widely held stocks often used as a proxy for the overall U.S. equity market. Indexes are unmanaged and have no fees or expenses. An investment cannot be made directly in an index. Swan’s investments may consist of securities which vary significantly from those in the benchmark indexes listed above and performance calculation methods may not be entirely comparable. Accordingly, comparing results shown to those of such indexes may be of limited use. The adviser’s dependence on its DRS process and judgments about the attractiveness, value and potential appreciation of particular ETFs and options in which the adviser invests or writes may prove to be incorrect and may not produce the desired results. There is no guarantee any investment or the DRS will meet its objectives. All investments involve the risk of potential investment losses as well as the potential for investment gains. Prior performance is not a guarantee of future results and there can be no assurance, and investors should not assume, that future performance will be comparable to past performance. All investment strategies have the potential for profit or loss. Further information is available upon request by contacting the company directly at 970-382-8901 or www.swanglobalinvestments.com. 054-SGI-020119