This site uses cookies. By continuing to browse the site, you are agreeing to our use of cookies. Privacy Policy
Okay, thanksWith all of the volatile political events happening domestically and internationally, the low market volatility over the past few years has puzzled investors. Many look at the low VIX and are confused as to why the markets don’t seem to be responding to unsteady current events in a corresponding fashion.
There are many reasons why volatility is low. There are intertwined relationships in the financial markets today, and assessing these relationships can provide a better understanding of volatility within a present and historical context.
Many investors look at volatility and, more specifically, the VIX as indicators of fear in the market. Contrary to popular belief, volatility is not an indication of fear. Volatility is simply the measurement of supply and demand manifested through market participants actively buying and selling.
Unfortunately, the VIX has a reputation that it should accurately measure the risk in the marketplace and serve as a “one-stop-shop” indicator for it. The expectation that the VIX is an actual representation of volatility or risk is inaccurate. Not surprisingly, the reliability of the VIX as a predictor of future market movements has suffered in recent years, and many incorrectly interpret this as if it simply does not work anymore. The VIX is not broken because it continues to measure what it was always designed to measure: the implied volatility of 30-day options in the S&P 500 index.
The VIX merely measures how many investors are buying or selling short-term options and can be used as a barometer for how much portfolio “insurance” is being purchased via SPX options. Insurance can be purchased for protecting downside market movements or upside movements, the latter in an attempt to participate with market gains. Recently, there has been an increase in buyers of upside VIX calls and VIXcall spreads. What this means is that portfolio managers are using VIX calls to hedge increases in volatility, and this has had a dampening effect on SPX option volatility.
Going into the summer of 2017, S&P 500 realized volatility was in the low single-digit percentiles of its distribution range going back nearly 90 years. Measures of S&P 500 short term implied volatility expressed by the VIX Index in late July 2017 touched an all-time intraday record low of 8.84.
This low volatility environment, however, is nothing new. The VIX experienced low bouts of volatility like this in 2005 and 2006. Volatility cycles between high and low periods, just as all market cycles undergo some degree of change either through external stimuli or evolution.
The daily closing historical average (since 1990) of the VIX has been slowly declining and now stands at 19.4. Since 2003, the VIX has closed below 16.25 approximately 50% of the time, and half of those occurrences have been under 13.2. With this in mind, a VIX in the 12–13 range is not “surprisingly” low.
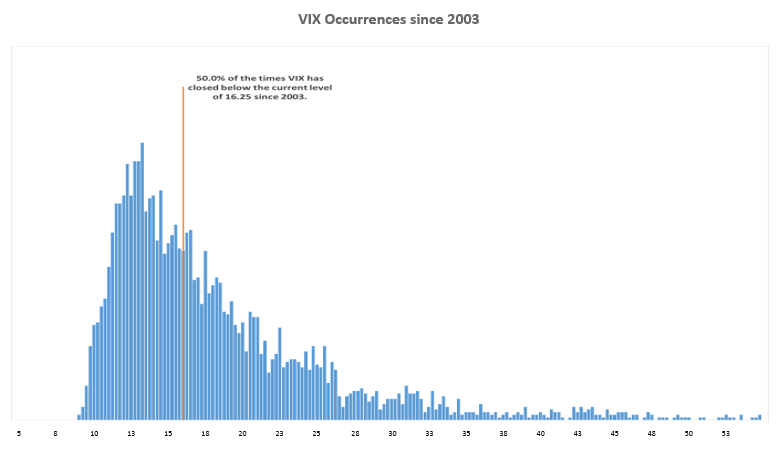
Source: TradeStation, Swan Global Investments
The current streak of no VIX closes above 20 is the third longest in history. The longest one occurred between 2004–2006 and lasted 558 days. Another notable period was between 1991 and 1996 when central banks were also accommodative in a pro-business environment.
Going back to 1928, comparable low volatility (historical) periods have had a median length of 15–16 months (Goldman Sachs, 2017), and there were several periods that lasted more than three years, so it is plausible that the current volatility regime extends further in time.
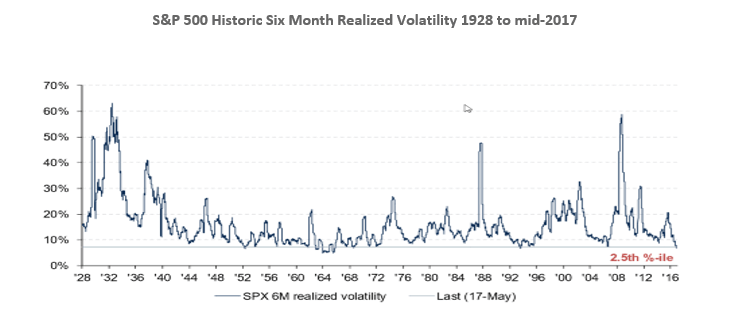
Source: BAML
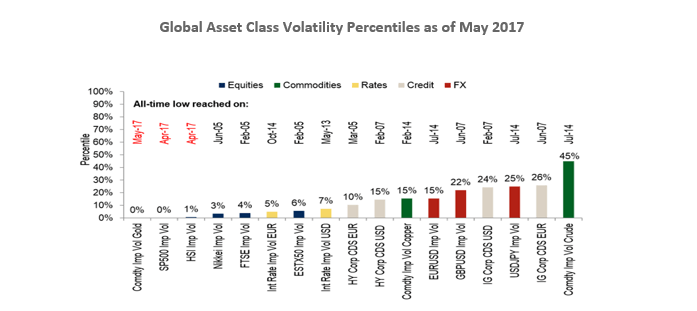
In addition, not only is US equity volatility extremely low, global volatility, including commodities and currencies, has followed suit.
A break from this “new normal” may be driven by increasing leverage and interest rates or a reduction of central bank balance sheets, or a big geopolitical shock. With the 2017 year behind us, the monthly average of the VIX is on pace to be the lowest in 15 years.
There are many theories as to why volatility has declined to these levels despite the current political and cultural climate. In complex, open-ended systems like financial markets, it is hard to pin outcomes to a single variable.
When analyzing volatility, it is unfitting to equate short-term volatility movement with long-term volatility movements. While the VIX can be very reactive in the short-term, long-term volatility is less sensitive to short-term events and more susceptive to structural shifts. These structural shifts can occur because of different phases in the business cycle—such as weakness in the economy or a slowdown in corporate earnings—or, as in the case today, asset correlations dropping. Index volatility is a function of single stock volatility, and if single stock correlations remain muted, this translates into lower index volatility.
Over the past year, Bloomberg data shows over $700 billion has flowed into broad-based passive funds/ETFs while active mutual funds have suffered redemptions of $240 billion. In theory, if this increase in passive inflows was the principal catalyst for rising equity prices, S&P 500 correlation levels should rise in lockstep, but the opposite has happened, with index correlations near record lows. This means that passive flows into broad-based indices are not uniformly raising all stocks.
With volatility so low, the cost of hedging a portfolio has been reduced to at or near ten -year lows. Even so, many portfolio managers are electing to forego hedging in a feeble attempt to add “alpha,” ignoring the possibility of systematic market declines. The decision to not hedge has had an impact on volatility simply because there are fewer buyers of option premium.
Other elements contributing to subdued volatility are the impact of risk parity funds, the proliferation of systematic volatility premium harvesting programs, and macro decorrelation.
Careful what you wish for.
It is difficult to determine what exactly is causing this extended low-volatility environment or to predict how long it will last. Even if high correlations are discovered, they rarely remain constant. Without being able to pinpoint a specific cause, it is virtually impossible to predict what will result in a spike or when the low volatility will end. This, coupled with the frailties of human nature, presents a low probability expectation for market timing strategies.
A Rude Awakening
Often, prolonged periods of low volatility are followed by violent spikes in volatility, as market participants who have been lulled to a false sense of security are awakened by an event of some sort. We don’t know when or how, but volatility will not remain so low forever and a new vol regime will arise.
So, what is the best way to handle the unpredictable and uncertain low volatility environment? To remain always invested and always hedged.
Chris Hausman, CMT®, Portfolio Manager, Managing Director-Risk, focuses on risk assessment and management for the Defined Risk Strategy investments and positions. He monitors risk across all of Swan’s portfolios and prepares stress tests, risk assessment reports and contributes to strategic decision making for the investment management team, as well as serving as an additional layer of oversight for the trading team. As a Chartered Market Technician, he also acts as Chief Technical Strategist at Swan Global Investments.
Swan Global Investments, LLC is a SEC registered Investment Advisor that specializes in managing money using the proprietary Defined Risk Strategy (“DRS”). SEC registration does not denote any special training or qualification conferred by the SEC. Swan offers and manages the DRS for investors including individuals, institutions and other investment advisor firms. Any historical numbers, awards and recognitions presented are based on the performance of a (GIPS®) composite, Swan’s DRS Select Composite, which includes non-qualified discretionary accounts invested in since inception, July 1997, and are net of fees and expenses. Swan claims compliance with the Global Investment Performance Standards (GIPS®).
All Swan products utilize the Defined Risk Strategy (“DRS”), but may vary by asset class, regulatory offering type, etc. Accordingly, all Swan DRS product offerings will have different performance results due to offering differences and comparing results among the Swan products and composites may be of limited use. All data used herein; including the statistical information, verification and performance reports are available upon request. The S&P 500 Index is a market cap weighted index of 500 widely held stocks often used as a proxy for the overall U.S. equity market. Indexes are unmanaged and have no fees or expenses. An investment cannot be made directly in an index. Swan’s investments may consist of securities which vary significantly from those in the benchmark indexes listed above and performance calculation methods may not be entirely comparable. Accordingly, comparing results shown to those of such indexes may be of limited use. The adviser’s dependence on its DRS process and judgments about the attractiveness, value and potential appreciation of particular ETFs and options in which the adviser invests or writes may prove to be incorrect and may not produce the desired results. There is no guarantee any investment or the DRS will meet its objectives. All investments involve the risk of potential investment losses as well as the potential for investment gains. Prior performance is not a guarantee of future results and there can be no assurance, and investors should not assume, that future performance will be comparable to past performance. All investment strategies have the potential for profit or loss. Further information is available upon request by contacting the company directly at 970–382-8901 or www.www.swanglobalinvestments.com. 097-SGI-021518