This site uses cookies. By continuing to browse the site, you are agreeing to our use of cookies. Privacy Policy
Okay, thanksThe volatility of an option’s underlying asset is one of the major factors in determining the value of that option. An option’s sensitivity to volatility is known as “vega” and is one of the so-called “Greeks” that are used to determine an option’s value. Other Greeks include delta, gamma, theta, and rho.
A simple trick to remember: “V” is for Volatility and Vega.
In a recent blog post, we examined how the impact of volatility drag, or variance drain, is the detrimental impact that volatility has upon a a buy-and-hold investment and an investor’s long-term wealth. Generally speaking, the more volatile the investment and the longer the holding period, the more an investor’s wealth is adversely impacted by volatility. But what impact does volatility have on options?
In option pricing, volatility takes on an entirely different meaning. In fact, when it comes to understanding the impact that volatility has on the price of an option, it might be useful to completely set aside what one knows about volatility’s impact upon long-term, buy-and-hold investing. The two are actually separate conversations.
Generally speaking, the more volatile the underlying asset the more valuable the option will be. Why is this? In most traditional schools of finance, volatility is treated as risk and something to be avoided.
Why is higher volatility associated with higher option prices? It is important to remember that option pricing is all based upon probabilities.
Beyond ‘death and taxes’, nothing is certain to happen; but the probability of something happening or not will drive an option’s value.
In the following graph we see the return distribution for three different assets.
There is a rather large range of plausible outcomes.
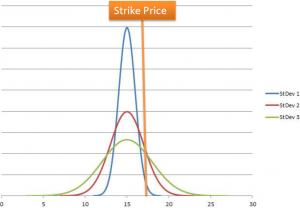
Source: www.lisashea.com, Swan Global Investments
The gap between implied and realized volatility can be a source of profit if one systematically sells overpriced options and collects the premium, and then buys them back at a lower price at a later date.
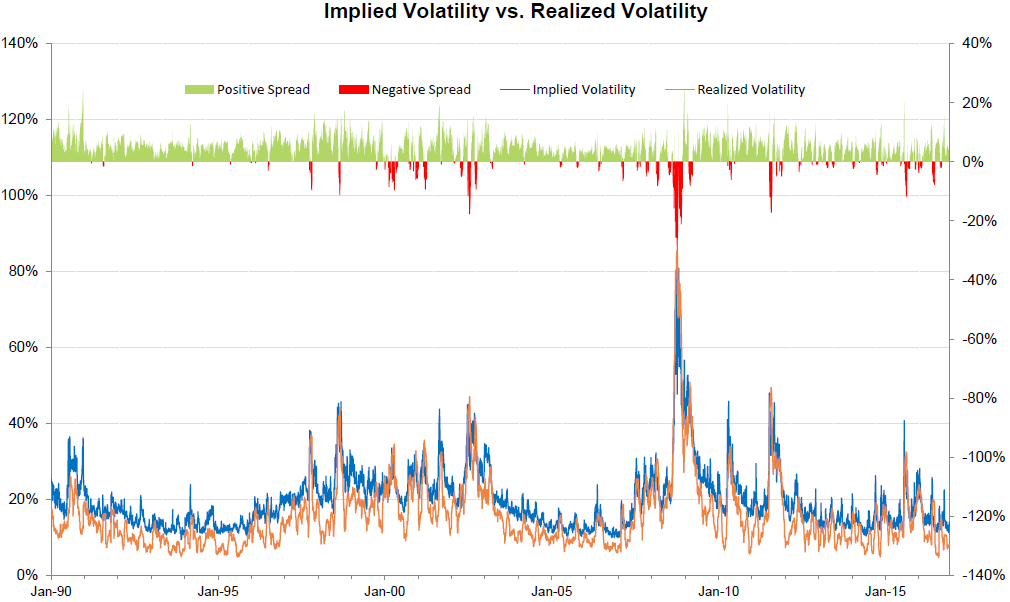
Source: Bloomberg and SG Financial Engineering
Changing the Game in Emerging Markets Investing Download PDF Investing in a Volatile Asset Class In a world of low yields and sluggish growth in most of the developed world, many consider emerging […]
NEXT ARTICLEMarc Odo, CFA®, CAIA®, CIPM®, CFP®, Client Portfolio Manager, is responsible for helping clients and prospects gain a detailed understanding of Swan’s Defined Risk Strategy, including how it fits into an overall investment strategy. Formerly Marc was the Director of Research for 11 years at Zephyr Associates.
Swan Global Investments, LLC is a SEC registered Investment Advisor that specializes in managing money using the proprietary Defined Risk Strategy (“DRS”). SEC registration does not denote any special training or qualification conferred by the SEC. Swan offers and manages the DRS for investors including individuals, institutions and other investment advisor firms. Any historical numbers, awards and recognitions presented are based on the performance of a (GIPS®) composite, Swan’s DRS Select Composite, which includes non-qualified discretionary accounts invested in since inception, July 1997, and are net of fees and expenses. Swan claims compliance with the Global Investment Performance Standards (GIPS®). All data used herein; including the statistical information, verification and performance reports are available upon request. The S&P 500 Index is a market cap weighted index of 500 widely held stocks often used as a proxy for the overall U.S. equity market. Indexes are unmanaged and have no fees or expenses. An investment cannot be made directly in an index. Swan’s investments may consist of securities which vary significantly from those in the benchmark indexes listed above and performance calculation methods may not be entirely comparable. Accordingly, comparing results shown to those of such indexes may be of limited use. The adviser’s dependence on its DRS process and judgments about the attractiveness, value and potential appreciation of particular ETFs and options in which the adviser invests or writes may prove to be incorrect and may not produce the desired results. There is no guarantee any investment or the DRS will meet its objectives. All investments involve the risk of potential investment losses as well as the potential for investment gains. Prior performance is not a guarantee of future results and there can be no assurance, and investors should not assume, that future performance will be comparable to past performance. All investment strategies have the potential for profit or loss. Further information is available upon request by contacting the company directly at 970–382-8901 orwww.www.swanglobalinvestments.com. 032-SGI-012717