This site uses cookies. By continuing to browse the site, you are agreeing to our use of cookies. Privacy Policy
Okay, thanksIn a recent Swan blog post, we explored how the active-vs-passive debate misses the point by failing to discuss what investors care about most: absolute performance and risk management. In this post, we will dive deeper by analyzing the broad market’s impact on a variety of manager types.
The technique we will use for this analysis is referred to as linear regression. It’s called a linear regression because you literally draw a straight line through a scatterplot of a manager’s returns and the benchmark. The goal of the linear regression is to get a line that best fits the data. Alpha, beta, and R-squared (R2) are generated via a linear regression.
From a statistical standpoint, this is a well-established technique. But from an investing standpoint, does it really make any sense to track that line of best fit? If the market is down -30%, -40%, or -50%, shouldn’t the investor try to be as far away from that market line as possible?
To explore this further, we analyze the impact of systematic risk on four types of strategies, namely:
Below we see a linear regression for the Vanguard 500 fund (VFINX) from January 1998 to December 2016 using annual returns. There are no surprises here. Its plot points are immediately recognizable. The -37.02% return was 2008, the +32.18% return was 2013, et cetera. The returns of the passive fund track the S&P 500 index as closely as possible; the fund is doing exactly what it should be doing. But the problem is when the market tanks, the fund tracks it down in lock-step. In essence, it IS the market.
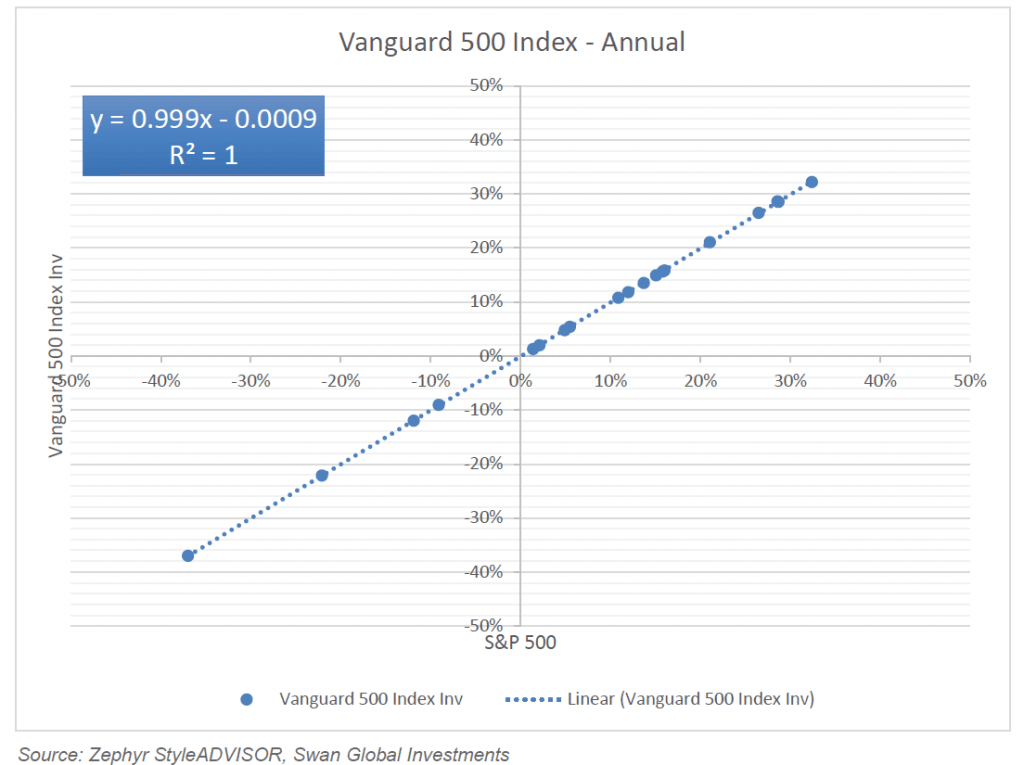
Essentially, the equation for the regression is the capital asset pricing model. The 0.999 coefficient is the slope of the line, also known as beta. The y-intercept of -0.0009 is the alpha, which is slightly negative due to fees. We see the R2 as a perfect 1 (or 100%) meaning the 100% of the variance of returns in the fund is explained by the variance of returns in the benchmark.
Let us now look at a traditional active manager. In this case, we are looking at one of the most popular funds in existence, the Growth Fund of America (AGTHX). Again, we will use the time frame January 1998 to December 2016 and annual returns.
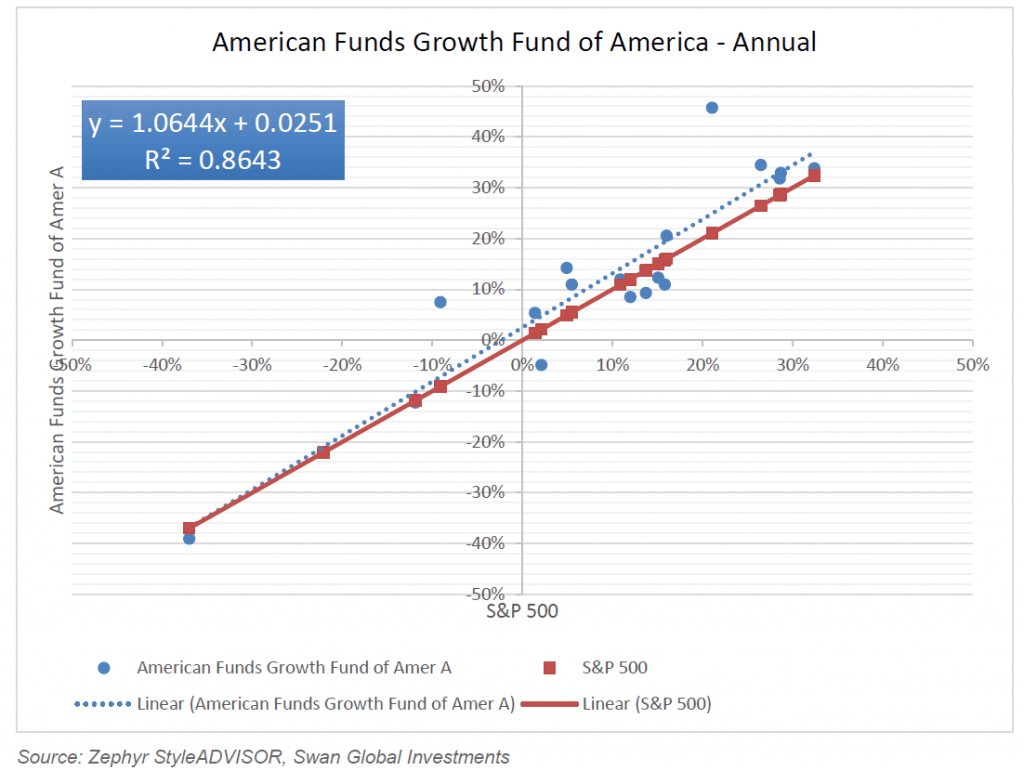
Unlike the Vanguard index fund, the straight red line of the S&P 500 does not perfectly fit this data. However, it isn’t very difficult to draw the blue dotted line through the scatterplot and come up with a solution that captures 86.43% of the variance of returns. We see Growth Fund’s beta being slightly above 1.0 as the coefficient is 1.064 and we see a positive alpha, even after taking into account fees. But seeing how closely the individual dots hug the red line of the S&P 500, we can conclude that systematic risk is the primary driver of performance.
What about a factor-driven, “smart beta” strategy, like DFA US Large Value (DFLVX)? Even though this is classified as a large cap value fund, the majority of its returns can be explained by the S&P 500 (red line). There is slightly more dispersion from the best fit line than we saw with Growth Fund of America, and there is positive alpha in this regression. But it is still safe to say by looking at the blue dotted line that the DFA fund has a linear relationship with S&P 500 market, for better or worse.
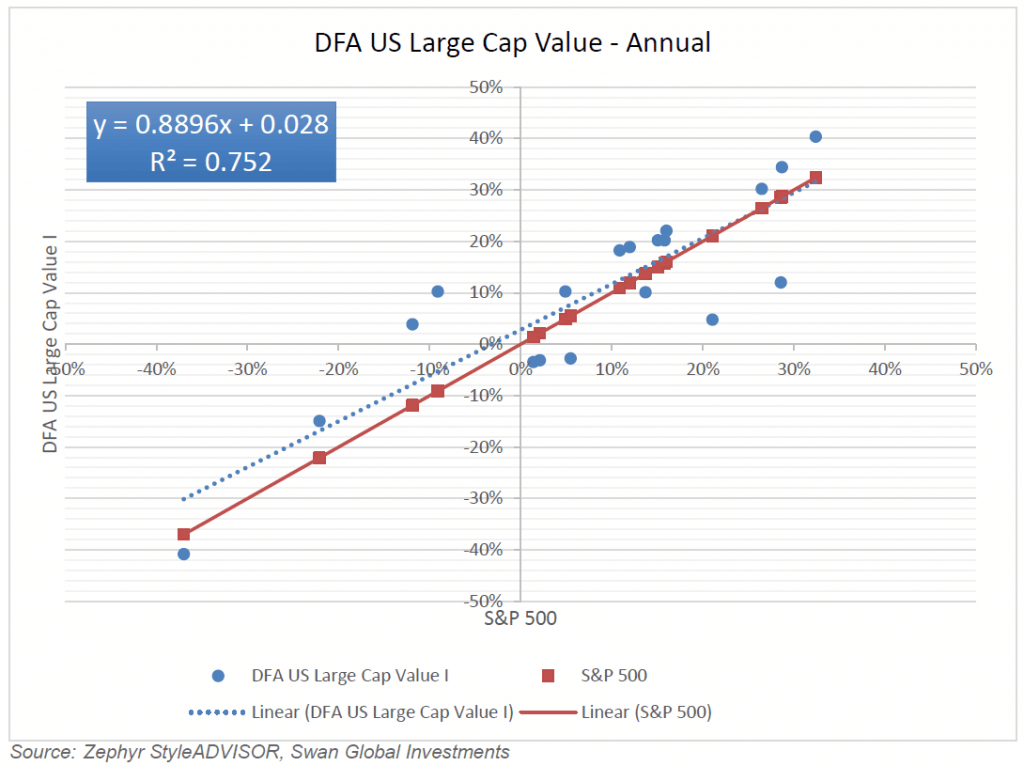
With both Growth Fund of America and DFA US Large Value we see that the market risk is the primary driver of both positive and negative returns. Broadly speaking, a bad year in the market equates to a bad year for the stock-picker or the factor fund. On the flip side, a good year in the market will mean a good year for either strategy.
Finally, let’s turn our attention to the Defined Risk Strategy. The dots of the scatterplot are much “flatter” than the red market line, meaning the beta is low. The DRS lacks some of the upside of the market, but more importantly, avoids a good portion of the downside. It is possible to draw a line through the data, but the blue, dotted regression line doesn’t do a very good job of explaining the DRS’s performance. The R2 “goodness of fit” is only 22.9%. There is positive alpha, meaning there has been an excess return harvested for the amount of risk taken.
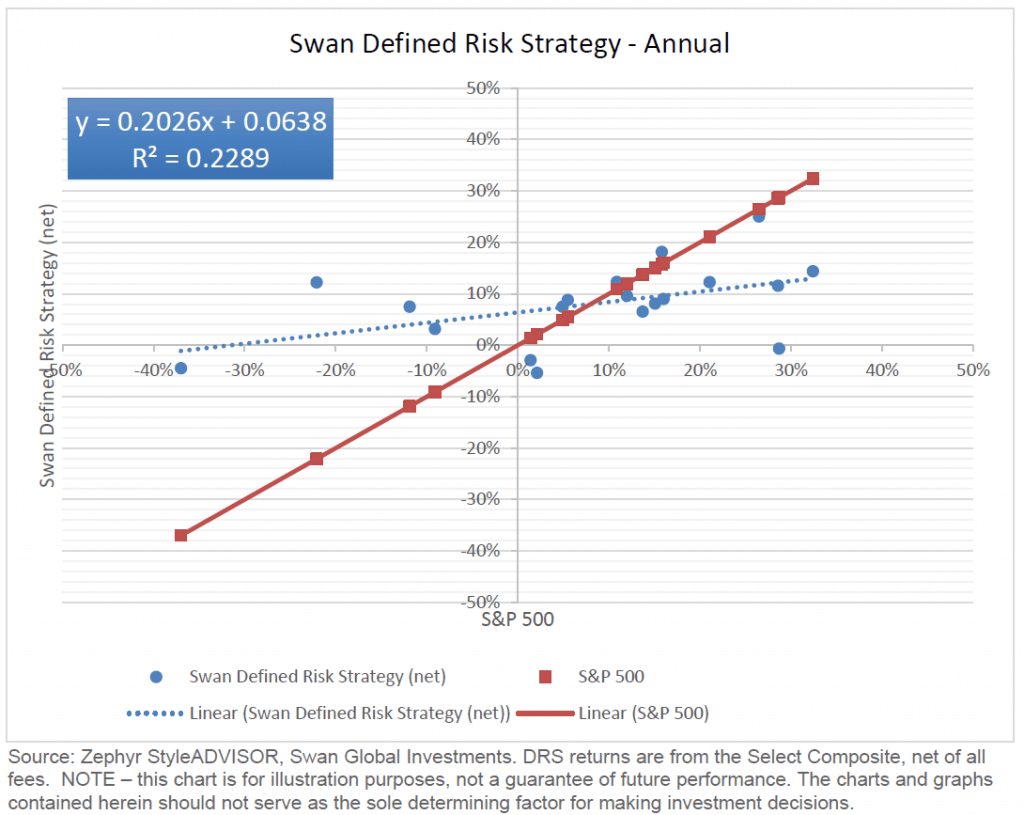
The reason why the DRS has such a unique regression is because of its hedging. Even though the markets were down in 2000, 2001, 2002 and 2008, the DRS participated little in those bear markets. There haven’t been any double-digit calendar year losses. Two of the negative years occurred during flat years in the market when the carrying cost of the hedge wasn’t offset by gains in the equity market or premium collection income (2011 and 2015). There haven’t been many years of extremely outsized returns, but most of the annual returns fall into a rather tight range, regardless of market conditions.
The DRS does not want a linear relationship to the market. The DRS seeks to participate in markets when they are rising, but actively hedges against downward moves.
The goal of the DRS is illustrated by a target return band. The target return band is one of the key concepts or tools we use at Swan.
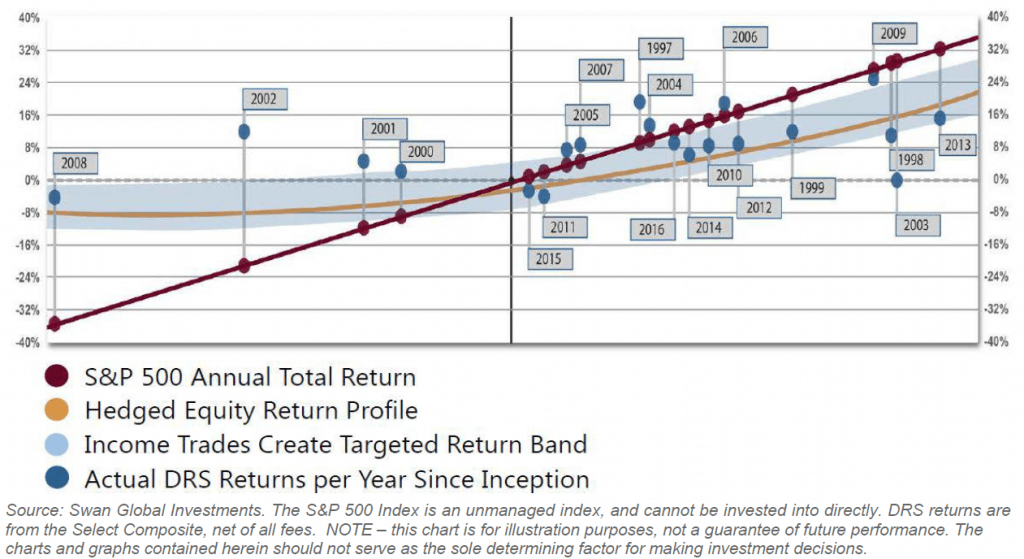
It is our goal that returns of the DRS will be within or above the blue shaded area. In 20 of 21 years, they have been.
For an in-depth discussion of the target return band please refer to the blog post, “The Target Return Band.”
Vanguard, American and DFA were chosen as representatives for the different investment approaches due to their popularity with investors and their long track records. However, based upon the results seen in the first section, I could have run similar regression analysis on just about any of the 1,451 mutual funds in the domestic equity space, and the vast majority of funds would have had scatterplots that looked very similar to American or DFA. This is why at the outset of this blog series, we made the claim that the decision between active and passive management is not the debate we should be having. The real risk to an investor, the risk we should be focused upon, is systematic risk.
The active vs. passive debate rages on, but at Swan Global Investments, our take is a bit different. Active or passive: it doesn’t matter. This engaging paper unpacks why, and more importantly, discover what may be overlooked in the broader debate.
NEXT ARTICLEMarc Odo, CFA®, CAIA®, CIPM®, CFP®, Director of Investment Solutions, is responsible for helping clients and prospects gain a detailed understanding of Swan’s Defined Risk Strategy, including how it fits into an overall investment strategy. Formerly, Marc was the Director of Research for 11 years at Zephyr Associates.
Swan Global Investments, LLC is a SEC registered Investment Advisor that specializes in managing money using the proprietary Defined Risk Strategy (“DRS”). SEC registration does not denote any special training or qualification conferred by the SEC. Swan offers and manages the DRS for investors including individuals, institutions and other investment advisor firms. Any historical numbers, awards and recognitions presented are based on the performance of a (GIPS®) composite, Swan’s DRS Select Composite, which includes non-qualified discretionary accounts invested in since inception, July 1997, and are net of fees and expenses. Swan claims compliance with the Global Investment Performance Standards (GIPS®).
All Swan products utilize the Defined Risk Strategy (“DRS”), but may vary by asset class, regulatory offering type, etc. Accordingly, all Swan DRS product offerings will have different performance results due to offering differences and comparing results among the Swan products and composites may be of limited use. All data used herein; including the statistical information, verification and performance reports are available upon request. The S&P 500 Index is a market cap weighted index of 500 widely held stocks often used as a proxy for the overall U.S. equity market. Indexes are unmanaged and have no fees or expenses. An investment cannot be made directly in an index. Swan’s investments may consist of securities which vary significantly from those in the benchmark indexes listed above and performance calculation methods may not be entirely comparable. Accordingly, comparing results shown to those of such indexes may be of limited use. The adviser’s dependence on its DRS process and judgments about the attractiveness, value and potential appreciation of particular ETFs and options in which the adviser invests or writes may prove to be incorrect and may not produce the desired results. There is no guarantee any investment or the DRS will meet its objectives. All investments involve the risk of potential investment losses as well as the potential for investment gains. Prior performance is not a guarantee of future results and there can be no assurance, and investors should not assume, that future performance will be comparable to past performance. All investment strategies have the potential for profit or loss. Further information is available upon request by contacting the company directly at 970–382-8901 or www.www.swanglobalinvestments.com. 254-SGI-100917