This site uses cookies. By continuing to browse the site, you are agreeing to our use of cookies. Privacy Policy
Okay, thanksIt’s easy to get swayed by annual forecasts or quarter earnings reports. But short-term perspectives can distract investors from longer-term challenges looming on the horizon.
The risk to both retail and professional investors is tinkering and tweaking portfolios in response to short-term “noise” and recent performance. The primary objective for investors with long-term goals should be to achieve their goals on time. Long-term goals require a longer-term view of the markets and risks.
Long-term investors face a daunting dual dilemma:
It is no surprise that annual return forecasts for capital markets over the next 5 to 10 years by major institutions are muted. This has meaningful implications for the typical 60/40 portfolio (60% stocks/ 40% bonds), shown below.
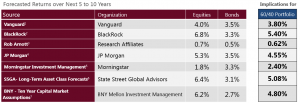
Source: Swan Global Investments. Forecast information pulled from numerous sources as of January 2019*
Potential for Taking on More Risk
Short-term outlooks may encourage investors to take on more risk as they seek out yield or returns in hot sectors or trendy momentum picks. As a result, they take on more risk than they might want to or understand—a fact demonstrated by lower and lower credit qualities seeping into client portfolios.
In a low-yield world, return chasing may lead to overweighting to equities. Over the last 50 years, the S&P 500 Index averaged 9% return per year. However, after a lengthy bull market (the second longest in history based on daily total returns), the S&P 500 Index now has a trailing 10-year average annual return of over 13%. Investors may now begin to expect or even demand similar equity returns going forward.
Highlighting a good quarter or year doesn’t necessarily illuminate how well a fund manager performed over meaningful periods of time or how they will perform going forward. Looking at monthly, quarterly, or even yearly trailing returns is like sprinting a marathon. It will get you to the next milestone quickly but is that a sustainable way for running a long distance?
Following the Market on the Way Up and the Way Down
By extension, investors checking their account balances every day, month, or quarter may result in potentially detrimental short-term changes as they compare short-term performance to the S&P 500 or other indices. Adjusting portfolios to mimic strategies or investments with strong recent returns or to match indices may result in the portfolio behaving too much like those investments when large sell-offs occur.
It may also encourage investors to lose sight of the long road ahead and the endurance necessary to stick to their financial plans.
Inconsistent Expectations
Furthermore, a shorter-term performance focus not only fails to determine where investors are headed or what steps they need to take to get there, but rarely provides the recipe for success. Market-timing strategies that rely upon being right about a wide range of inputs and getting the timing right regarding entry and exit of a host of investments over and over again have a low probability of sustainable success. Few can successfully time the market over 1-5 years, and even fewer can do this over 10 years or more.
Ultimately, it’s not about beating the market and looking like this year’s hero. Investors face significant challenges that require solutions with horizons beyond the next quarterly or annual meeting. This is a big opportunity for financial advisors to help their clients successfully navigate these challenges.
Long-term investors will inevitably face one or multiple bull and bear markets, so investment strategies that can deliver stable, consistent returns over full market cycles are better suited for investors with long-term horizons.
Short-term metrics do not measure consistency, and therefore do not necessarily offer meaningful insights into long-term investment planning. Making a decision for a financial plan that spans over 10, 20 or more years based on a metric that only looks back a quarter or year is at best useless and at worst actually harmful to a long-term, goals-based process.
The sign of an effective goals-based strategy is its ability to provide consistent returns over long-term rolling periods.
It’s not about the last quarter, or last year or next year. It’s about the next ten years—and beyond.
David Lovell, Managing Director – Head of Marketing, is responsible for Swan’s brand, marketing, content, events, and media. David began his career in the financial industry at Mass Mutual, where he held life, health and disabilities insurance licenses, as well as, Series 6 and 63 licenses. David currently holds a Series 65 license.
*Sources for returns:
Swan Global Investments, LLC is a SEC registered Investment Advisor that specializes in managing money using the proprietary Defined Risk Strategy (“DRS”). SEC registration does not denote any special training or qualification conferred by the SEC. Swan offers and manages the DRS for investors including individuals, institutions and other investment advisor firms. Any historical numbers, awards and recognitions presented are based on the performance of a (GIPS®) composite, Swan’s DRS Select Composite, which includes non-qualified discretionary accounts invested in since inception, July 1997, and are net of fees and expenses. Swan claims compliance with the Global Investment Performance Standards (GIPS®).
All Swan products utilize the Defined Risk Strategy (“DRS”), but may vary by asset class, regulatory offering type, etc. Accordingly, all Swan DRS product offerings will have different performance results due to offering differences and comparing results among the Swan products and composites may be of limited use. All data used herein; including the statistical information, verification and performance reports are available upon request. The S&P 500 Index is a market cap weighted index of 500 widely held stocks often used as a proxy for the overall U.S. equity market. Indexes are unmanaged and have no fees or expenses. An investment cannot be made directly in an index. Swan’s investments may consist of securities which vary significantly from those in the benchmark indexes listed above and performance calculation methods may not be entirely comparable. Accordingly, comparing results shown to those of such indexes may be of limited use. The adviser’s dependence on its DRS process and judgments about the attractiveness, value and potential appreciation of particular ETFs and options in which the adviser invests or writes may prove to be incorrect and may not produce the desired results. There is no guarantee any investment or the DRS will meet its objectives. All investments involve the risk of potential investment losses as well as the potential for investment gains. Prior performance is not a guarantee of future results and there can be no assurance, and investors should not assume, that future performance will be comparable to past performance. All investment strategies have the potential for profit or loss. Further information is available upon request by contacting the company directly at 970-382-8901 or www.swanglobalinvestments.com. 091-SGI-021519