This site uses cookies. By continuing to browse the site, you are agreeing to our use of cookies. Privacy Policy
Okay, thanksIn this, the fourth and final post in our Math Matters series, we discuss the distribution of returns and how investors react to “tail” events.
Everything we discussed previously in this series, “Compound Growth”, “The Importance of Avoiding Large Losses”, and “Volatility is a Drag”, culminates with this post on the shape of the distribution of returns.
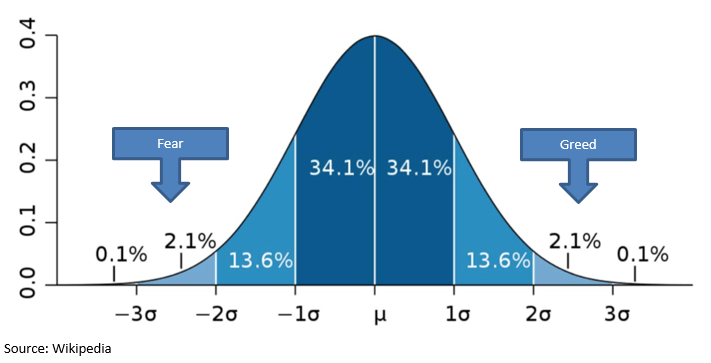
In the image below we see the textbook definition of a normal Gaussian distribution. Most of the occurrences fall near the mean value, while a few data points occur far from the mean. If a set of data over a long period of time falls into this pattern, then we can make assumptions about future occurrences with a high degree of accuracy.

However, in the real world two unfortunate facts collide with this theory and are impediments to an investor’s long-term success:
When these tail events do occur, investors tend to make poor choices.
Actual market returns do not fit the nice, clean, symmetric layout of the normal distribution.
It is often said that two things drive the market: fear and greed. That might not be true all of the time, but it does appear to be true when markets are at their extremes.
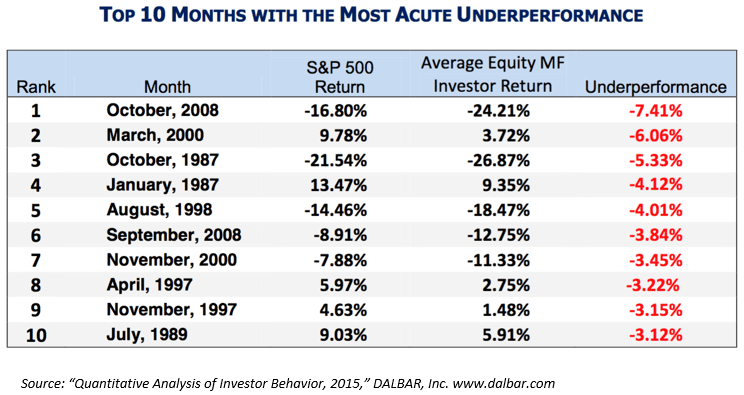
A recent study by DALBAR found that the average investor did much worse than the broad market. Moreover, the biggest gaps in underperformance tended to happen when markets were experiencing “tail” events.

Anyone with market experience will recognize the culprits: panic selling in a bear market, chasing after “hot” stories in a bull market, selling low and buying high…all of these are quantified in the above table. And in the previous posts on the mathematics of investing, we’ve seen how hard it is to overcome these mistakes once they happen. Sadly, investors are often their own worst enemy.
Another issue is that actual market returns don’t fit the idealized normal distribution.
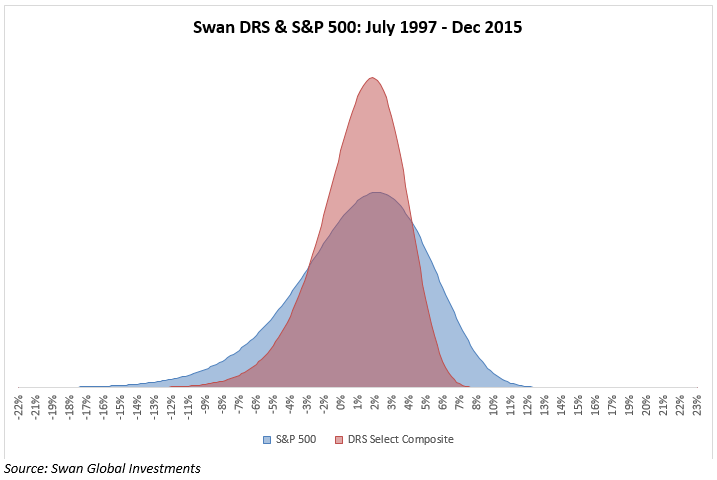
In this illustration below, we see the return distribution for the Swan Defined Risk Strategy, as represented by the Select Composite, superimposed over that of the S&P 500 for the period July 1997 to December 2015. It has two characteristics that mark its deviation from the normal distribution:
the S&P 500 has negative skewness, meaning the left-hand, negative tail is more extreme than the right-hand, positive tail; and
the distribution has positive excess kurtosis, meaning that the volatility that does occur tends to be driven by those extreme market events.

We see how the DRS has effectively minimized the impact of the tail events by pushing more of the observations towards the mean. While a distribution like this might be called “safe and boring” by some, we believe these types of results are best suited for long-term success.
In this post and the previous posts in this series, we have established that extreme losses and high volatility are harmful to investors from both a mathematical as well as a behavioral standpoint. And yet in the graph above we see that the actual market conditions are worse than what would have been predicted by a “normal” distribution.
Faced with these challenges, how should investors proceed?
At Swan Global Investments, we would argue that these problems are best avoided by implementing a strategy that seeks to reduce the impact of the tails and volatility as much as possible. If returns could be moved from the tails of the distribution to the middle range of the distribution, the investor would be better off.
Across these four blog posts and our white paper “Math Matters: Rethinking the Math Behind Investment Returns” we established four key points to achieving better investment results over time. They are:
The importance and power of compounding
The importance of volatility drag or ‘variance drain’
The value of a non-normal distribution of returns
Moreover, as an investment strategy, the Defined Risk Strategy was meant to be a manifestation of these principles.
The DRS should be viewed as a long-term, strategic solution and one that we believe has the best chance of helping investors stay invested and reach their goals over time.
To learn more about Swan’s Defined Risk investment approach or for more details regarding historical performance utilizing put options to hedge a portfolio since 1997, please contact Swan at 970–382-8901.
Every year experts rush to publish market forecasts. But how accurate are these predictions? See how reliable market forecasts are, and why we at Swan don’t make them.
NEXT ARTICLEMarc Odo, CFA®, CAIA®, CIPM®, CFP®, Client Portfolio Manager, is responsible for helping clients and prospects gain a detailed understanding of Swan’s Defined Risk Strategy, including how it fits into an overall investment strategy. Formerly Marc was the Director of Research for 11 years at Zephyr Associates.
Swan Global Investments, LLC is a SEC registered Investment Advisor that specializes in managing money using the proprietary Defined Risk Strategy (“DRS”). SEC registration does not denote any special training or qualification conferred by the SEC. Swan offers and manages the DRS for investors including individuals, institutions and other investment advisor firms. Any historical numbers, awards and recognitions presented are based on the performance of a (GIPS®) composite, Swan’s DRS Select Composite, which includes nonqualified discretionary accounts invested in since inception, July 1997, and are net of fees and expenses. Swan claims compliance with the Global Investment Performance Standards (GIPS®). All data used herein; including the statistical information, verification and performance reports are available upon request. The S&P 500 Index is a market cap weighted index of 500 widely held stocks often used as a proxy for the overall U.S. equity market. Indexes are unmanaged and have no fees or expenses. An investment cannot be made directly in an index. Swan’s investments may consist of securities which vary significantly from those in the benchmark indexes listed above and performance calculation methods may not be entirely comparable. All Swan products utilize the Defined Risk Strategy (“DRS”), but may vary by asset class, regulatory offering type, etc. Accordingly, all Swan DRS product offerings will have different performance results, and comparing results among the Swan products and composites may be of limited use. Economic factors, market conditions, and investment strategies will affect the performance of any portfolio and there are no assurances that it will match or outperform any particular benchmark. Therefore, comparing results shown to those of such indexes may be of limited use. The adviser’s dependence on its DRS process and judgments about the attractiveness, value and potential appreciation of particular ETFs and options in which the adviser invests or writes may prove to be incorrect and may not produce the desired results. There is no guarantee any investment or the DRS will meet its objectives. All investments involve the risk of potential investment losses as well as the potential for investment gains. This analysis is not a guarantee or indication of future performance. Prior performance is not a guarantee of future results and there can be no assurance, and investors should not assume, that future performance will be comparable to past performance. All investment strategies have the potential for profit or loss. Further information is available upon request by contacting the company directly at 970.382.8901 or visit www.swanglobalinvestments.com. 289-SGI-111016