This site uses cookies. By continuing to browse the site, you are agreeing to our use of cookies. Privacy Policy
Okay, thanksOption pricing is sometimes described as “multi-dimensional,” meaning a variety of factors simultaneously influence the price of an option. These factors are referred to as “the Greeks” and are named using letters of the Greek alphabet- delta, theta, rho, gamma, and vega. Understanding all of “the Greeks” is important in understanding how the price of an option or option strategy might fluctuate. In this post we will focus on delta.
The textbook definition is this: “Delta is the ratio comparing the change in the price of the underlying asset to the corresponding change in the price of a derivative.”
In other words, delta measures the sensitivity of price changes in the option relative to price changes in the underlying asset.
The Delta of an option shifts based on changes in price of the underlying asset.
Delta, not to be confused with beta, has a non-linear relationship with the price of the underlying, which when illustrated shows how loss reduction occurs as delta shifts down.
If these definitions sound familiar, they should. For those trained in traditional finance, these definitions sound a lot like beta.
Before option pricing theory was fully developed, William Sharpe, Jack Treynor, and a few others developed the Capital Asset Pricing Model and the concept of beta.
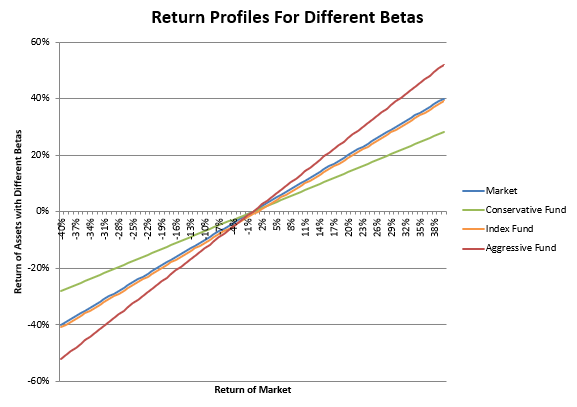
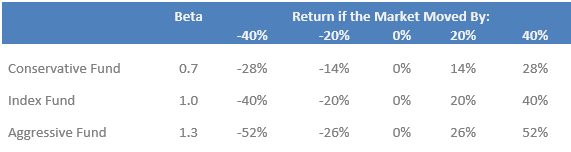
Beta measures how sensitive an asset’s price is to movements in the broad market. Therefore:
The graph and table below illustrate these three scenarios:
Source: Swan Global Investments
Take-Away #1
One key takeaway from this graph is that beta is assumed to be linear.
In plain English, regardless of where the market might be, the beta relationship is assumed to be constant.
It doesn’t matter if the market is down 20% or up 35%, if an asset’s beta was estimated to be 1.15, it will be 1.15 regardless of where the market is.
Delta is similar to beta, but with a key difference.
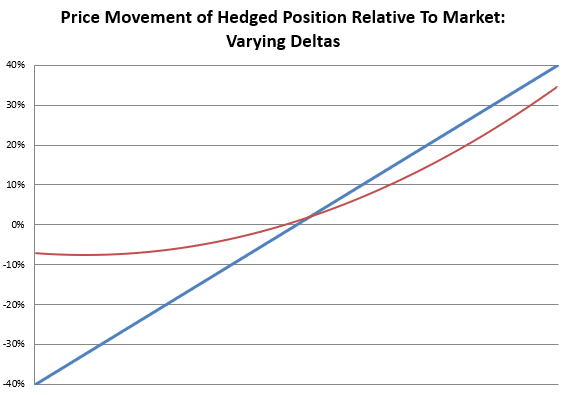
Like beta, delta measures price sensitivity relative to changes in the independent variable. However, the key difference is that delta is NOT a linear relationship.
The relationship between an option and the underlying asset is illustrated below. The price movements follow a curved line, sometimes informally referred to as a “hockey stick” pattern.
Source: Swan Global Investments
But most important is the fact that, the delta of an option changes or shifts; it is not constant.
Take-Away #2
From a practical standpoint, the more the market moves downward, the more the portfolio is protected as the delta shifts down. This means it takes a while for downside protection to fully kick in.
In a future blog post we will discuss the reasons why delta is not constant. It has to do with a concept known as the “moneyness” of an option. In order to round out this blog post, we will instead focus on how delta impacts the performance of a hedged strategy.
Let’s assume a hedged strategy starts off with a delta of around 0.50.
Scenario 1:
From that initial point, if the market were to go down 10%, the strategy would likely go down 5%. If the market continued down, the delta would now be different, more in the neighborhood of 0.25. If the market sold off another 10% the strategy should be down an additional 2.5% or so. Once market has sold off from the hedge point by 20% or more, that is where we enter the flat part of the curve where the delta is zero.
Scenario 2:
Conversely, if the market were to go up 10% from the hedge point, the strategy would go up in the neighborhood of 5%. If the market continued upwards, the strategy would likely capture three-quarters of the next 10%, as the delta would move toward 0.75. As the delta reaches 1.0, the strategy should then see dollar-for-dollar gains past that point.
It is important to note this simple example and scenarios are meant to be a general framework on understanding delta and price relationship between options and the underlying asset.
The example excludes some of the other factors that will undoubtedly impact the total performance of Swan’s Defined Risk Strategy. These changes include, but are not limited to, the impact of the market-neutral, premium-collection income trades, which is a significant component of the overall DRS returns. Also, performance dispersions can occur due to the equally-weighted sector approach used relative to the cap-weighted S&P 500. Finally, as we mentioned at the outset, option pricing is multi-dimensional, and will be influenced by the other Greeks like gamma, vega, theta, and rho. We will take a look at these other factors in future blog posts.
The Pain Ratio — A Better Risk/Return Measure Download PDF Pain Ratio vs. Standard Deviation In a previous post, we discussed the pain index as a better measure of risk. Now we’ll explore […]
NEXT ARTICLEMarc Odo, CFA®, CAIA®, CIPM®, CFP®, Client Portfolio Manager, is responsible for helping clients and prospects gain a detailed understanding of Swan’s Defined Risk Strategy, including how it fits into an overall investment strategy. Formerly Marc was the Director of Research for 11 years at Zephyr Associates.
Swan Global Investments, LLC is a SEC registered Investment Advisor that specializes in managing money using the proprietary Defined Risk Strategy (“DRS”). SEC registration does not denote any special training or qualification conferred by the SEC. Swan offers and manages the DRS for investors including individuals, institutions and other investment advisor firms. Any historical numbers, awards and recognitions presented are based on the performance of a (GIPS®) composite, Swan’s DRS Select Composite, which includes non-qualified discretionary accounts invested in since inception, July 1997, and are net of fees and expenses. Swan claims compliance with the Global Investment Performance Standards (GIPS®). All data used herein; including the statistical information, verification and performance reports are available upon request. The S&P 500 Index is a market cap weighted index of 500 widely held stocks often used as a proxy for the overall U.S. equity market. Indexes are unmanaged and have no fees or expenses. An investment cannot be made directly in an index. Swan’s investments may consist of securities which vary significantly from those in the benchmark indexes listed above and performance calculation methods may not be entirely comparable. Accordingly, comparing results shown to those of such indexes may be of limited use. The adviser’s dependence on its DRS process and judgments about the attractiveness, value and potential appreciation of particular ETFs and options in which the adviser invests or writes may prove to be incorrect and may not produce the desired results. There is no guarantee any investment or the DRS will meet its objectives. All investments involve the risk of potential investment losses as well as the potential for investment gains. Prior performance is not a guarantee of future results and there can be no assurance, and investors should not assume, that future performance will be comparable to past performance. All investment strategies have the potential for profit or loss. Further information is available upon request by contacting the company directly at 970–382-8901 orwww.www.swanglobalinvestments.com. 102-SGI-050216