This site uses cookies. By continuing to browse the site, you are agreeing to our use of cookies. Privacy Policy
Okay, thanksThe last of the “Big 5” Greeks we will be looking at is Gamma.
The Greek philosopher Heraclitus once stated, “The only thing that is constant is change.” The same can be said for theoretical option values.
There are a multitude of factors that go into the option pricing model such as underlying price, strike price, volatility, days to maturity, interest rates, and dividends. These inputs are all used to calculate what a “fair” value price of a given option should be trading in the marketplace. If any of these inputs change, the value of the option will also change.
The option pricing model calculates “sensitivities” to changes in premium. In other words, we can measure exactly how much a given option value will change with a change in any one of the inputs.
The most common measurement, or “Greek,” is known as Delta. In a previous post, we explained how Delta is the first derivative in the option pricing model with respect to changes in the underlying price. More specifically, it measures how much an option’s value changes for a $1 move in the stock or index value.
As a stock moves up or down, the Deltas of options in relation to that stock must also change.
For example, let’s say we own the June 100 call with the stock trading at $100. From our knowledge of Delta, we can conclude that this option has approximately a +50 Delta. If the stock moves up from $100 to $101, the call option is now in the money and the Delta moves towards 100.
Gamma, on the other hand, measures the change in Delta for a $1 move in the underlying. It is simply known as the “change in change.”
The Greek letter “G,” pronounced ‘ɡamə’.
Gamma is the second derivative in an option pricing formula with respect to changes in the underlying and is the only second derivative among the “Big 5” Greeks (Delta, Gamma, Vega, Theta, and Rho).
Phrased differently, Gamma does not measure direct changes to option premiums; instead, it measures the change in Delta. By definition, Gamma is expressed as a percentage of a $1 move in stock or index price. However, it is much simpler to remember that Gamma is just a number added or subtracted to the current Delta of an option when the underlying moves $1.
Using our previous example, if the Delta of an option is +50 but increases to 60 as the stock increases by $1, then the Gamma would be 10—the difference between the change in Delta.
Just like Delta, Gamma has boundaries. Remember the Delta of an option is bounded by 0 to 100 cents (or -100 to 0) because as a function of stock price movement only, an options premium cannot move more than $1 for each $1 move in the corresponding underlying.
Gamma also has the same boundaries because the maximum amount that Delta could change is 100. In other words, an option that has a Delta of zero (out of the money option about to expire) could all of a sudden have a Delta of 100 (in the money option about to expire). This change in Delta for a $1 move in the underlying is Gamma.
Put-Call Parity
Long or short options have positive or negative Gammas whether they are calls or puts. Remember that option pricing models assume Delta neutrality, which assumes identical pay-off structures can be replicated various ways with options. It is possible to construct synthetic long underlying by purchasing a call and selling a put on the same underlying with the same strike and expiration.
We know that the Delta of underlying is always 100; therefore, the Delta of synthetic stock (long call and short put) should always be 100 as well.
In our previous example, the June 100 call had a Gamma of 10 and the Delta increased from 50 to 60 as the stock rose $1. The put will have the same Gamma as the call and its Delta will also move by 10. The trick with puts, however, is that they have negative Deltas. So, the June 100 put, which also started out as an at the money option with a -50 Delta, moves from -50 to -40. This is a positive increase in Delta. If we apply the synthetic stock check, we see that the new call Delta (+60) plus the Delta of the short put (+40) adds up to +100 Deltas.
In summary, the Gammas of puts and calls on the same underlying, expiration, and strike will equal each other as a result of put-call parity.
Now let’s look at what strikes have the most Gamma within the same expiration.
At the Money Options and Gamma
As a general rule, the at the money strike will have the most Gamma within an expiration. The change in Delta will be most pronounced as an option moves from being at the money to either in or out of the money.
By examining an extreme example, we can imbed the concept of an at the money option having the most Gamma.
Let’s say an at the money option is seconds from expiring. The option pricing model will still show the option as having a 50 Delta. If the underlying moves up and the option expires, a call option will now have a 100 Delta and the corresponding put will have a 0 Delta. This is quite a large move in the Delta and thus shows how at the money options have the most Gamma.
For another way to understand what Gamma is like, let us turn to an analogy.
Say, for example, you have two basketball teams, maybe North Carolina and Villanova. When are changes to the score most important? Obviously, in a close game with only a few seconds left on the clock. If the score is Villanova 74, North Carolina 71 with only 6.7 seconds left, ANY change in the variables matter, but a made three pointer will change the complexion of the game entirely. This is the “high Gamma” part of the game. If the score is tight, that is like having a near- or at-the-money option where small moves in price will determine whether that option is a winner (in the money) or loser (out of the money).
Out of the Money Options and Gamma
What about strikes that are further away from the underlying price? Well, as expiration approaches, out of the money options are approaching 0 Delta and in the money options are approaching 100 Delta, so their Delta will not move as much as the Delta of an at the money option. Thus, when Gamma is small in absolute terms, Delta changes slowly with changes in the underlying asset price. However, if Gamma is large in absolute terms, Delta is highly sensitive to the changes in the underlying asset price.
Using our previous example of a basketball game, imagine a situation where we are only five minutes into the first half of the game or maybe a game that is a blowout. A bucket is still worth two or three points, but its impact on the final outcome is much less important. Changes to the score aren’t as important in those situations. Along those same lines, if there is a lot of time left to expiration, or if the option is deep in or out of the money, Gamma is lower.
Time and Gamma
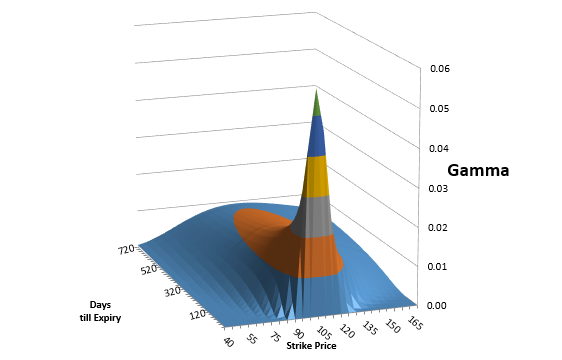
With respect to time, shorter term options will have more Gamma than longer term options. Referring to our expiration example, an option with more time will not have such a pronounced Delta change as one that is expiring sooner. The chart below illustrates both Gammas with respect to time and strike location. Options with more time until expiration have smoother Gammas, with the at the money strike (at the money = 100) still having the most Gamma within a given expiration. One can clearly see how the Gamma increases greatly as expiration approaches, again, with the at the money strike still having the most Gamma than surrounding strikes.
Conclusion
Even though Gamma does not directly measure changes in option values for changes in underlying prices, it is still an important risk measurement.
It signifies the potential changes in option premium as measured by Delta. Many option premium strategies are short term in nature, and as a result, these strategies take on a tremendous amount of Gamma risk.
Premium selling strategies that appear Delta-neutral may have hidden risks such as Deltas moving around as options approach expiration or the potential for certain types of spreads to produce an inordinate number of Deltas under certain market conditions.
One of the benefits of short premium strategies is the collection of Theta, or time decay; however, Gamma can quickly wipe out any Theta benefit if the underlying begins to move towards the short strike and the options approach expiration. A premium selling program must not only be concerned about maximizing Theta, but minimizing the effects of Gamma and the resulting Deltas on a portfolio.
A portfolio manager can never just focus on one type of risk but must juggle all of them to produce the most suitable risk-reward profile. Only a sound management process void of “blinders” can concurrently navigate all the risks while adding incremental returns to a portfolio in all market conditions.
As the World Turns: Applying a Defined Risk Strategy to Foreign Developed Markets ETFs Download PDF The World Spins Madly On Let’s turn back the calendar a year and remember where we […]
NEXT ARTICLEChris Hausman, CMT®, Portfolio Manager, Managing Director-Risk, focuses on risk assessment and management for the Defined Risk Strategy investments and positions. He monitors risk across all of Swan’s portfolios and prepares stress tests, risk assessment reports and contributes to strategic decision making for the investment management team, as well as serving as an additional layer of oversight for the trading team. As a Chartered Market Technician, he also acts as Chief Technical Strategist at Swan Global Investments.
Swan Global Investments, LLC is a SEC registered Investment Advisor that specializes in managing money using the proprietary Defined Risk Strategy (“DRS”). SEC registration does not denote any special training or qualification conferred by the SEC. Swan offers and manages the DRS for investors including individuals, institutions and other investment advisor firms. Any historical numbers, awards and recognitions presented are based on the performance of a (GIPS®) composite, Swan’s DRS Select Composite, which includes non-qualified discretionary accounts invested in since inception, July 1997, and are net of fees and expenses. Swan claims compliance with the Global Investment Performance Standards (GIPS®). All data used herein; including the statistical information, verification and performance reports are available upon request. The S&P 500 Index is a market cap weighted index of 500 widely held stocks often used as a proxy for the overall U.S. equity market. Indexes are unmanaged and have no fees or expenses. An investment cannot be made directly in an index. Swan’s investments may consist of securities which vary significantly from those in the benchmark indexes listed above and performance calculation methods may not be entirely comparable. Accordingly, comparing results shown to those of such indexes may be of limited use. The adviser’s dependence on its DRS process and judgments about the attractiveness, value and potential appreciation of particular ETFs and options in which the adviser invests or writes may prove to be incorrect and may not produce the desired results. There is no guarantee any investment or the DRS will meet its objectives. All investments involve the risk of potential investment losses as well as the potential for investment gains. Prior performance is not a guarantee of future results and there can be no assurance, and investors should not assume, that future performance will be comparable to past performance. All investment strategies have the potential for profit or loss. Further information is available upon request by contacting the company directly at 970–382-8901 orwww.www.swanglobalinvestments.com. 161-SGI-063017